In 2025, managing a SaaS e-commerce platform running on multi-region EKS clusters with microservices spread across AWS accounts means dealing with complex infrastructure. Our core transaction system relies on an RDS PostgreSQL instance and several S3 buckets for order and payment data.
Suppose it’s late at night during peak traffic, and an API Gateway in us-west-2 starts timing out. CloudWatch dashboards show everything green, average service response hovers around 200ms, and no alerts. But when you dig into the [.code]prod-api-gateway logs[.code], you find 99th percentile latencies spiking to 5 seconds on 5% of requests.
The root cause is a spike in checkout traffic overwhelming the RDS connection pool, silently throttling backend services, and cascading into gateway timeouts. This metric isn’t part of the standard “Golden Signals”: latency, traffic, errors, and saturation. In today’s containerized, auto-scaling environments, relying solely on these standard signals leaves critical blind spots.
This article outlines 7 infrastructure metrics every devops or platform engineer should track to improve operational resilience, reduce incidents, and manage costs effectively. Drawing on experience managing 200+ Terraform resources in complex AWS environments, these metrics go beyond the basics to catch early warning signs before issues impact users.
Why Do Infrastructure Metrics Matter?
Infrastructure metrics are quantitative measures of your infrastructure’s health, performance, and cost, providing early warnings of degradation in compute, storage, networking, or database resources. Unlike application-level metrics (e.g., API response codes), infrastructure metrics focus on the underlying cloud and Kubernetes components like EKS nodes, RDS instances, S3 buckets, or VPC networks that support your services.
Nowadays, with architectures ranging from serverless functions to container clusters, and an increasing emphasis on cost management through FinOps, these metrics are essential for spotting potential issues early, such as resource limits being approached, configuration mismatches, or unexpected cost spikes, before they affect your users or your organization’s budget. For our multi-region cloud setup, running various microservices on EKS with Terraform-managed resources and GitLab CI/CD pipelines, tracking the right metrics has reduced the downtime of our applications by 25% and incident response time by 40%.
Below are 7 metrics for maintaining reliability, performance, and cost efficiency in a cloud-native setup.
The Core Metrics DevOps Engineers Must Track

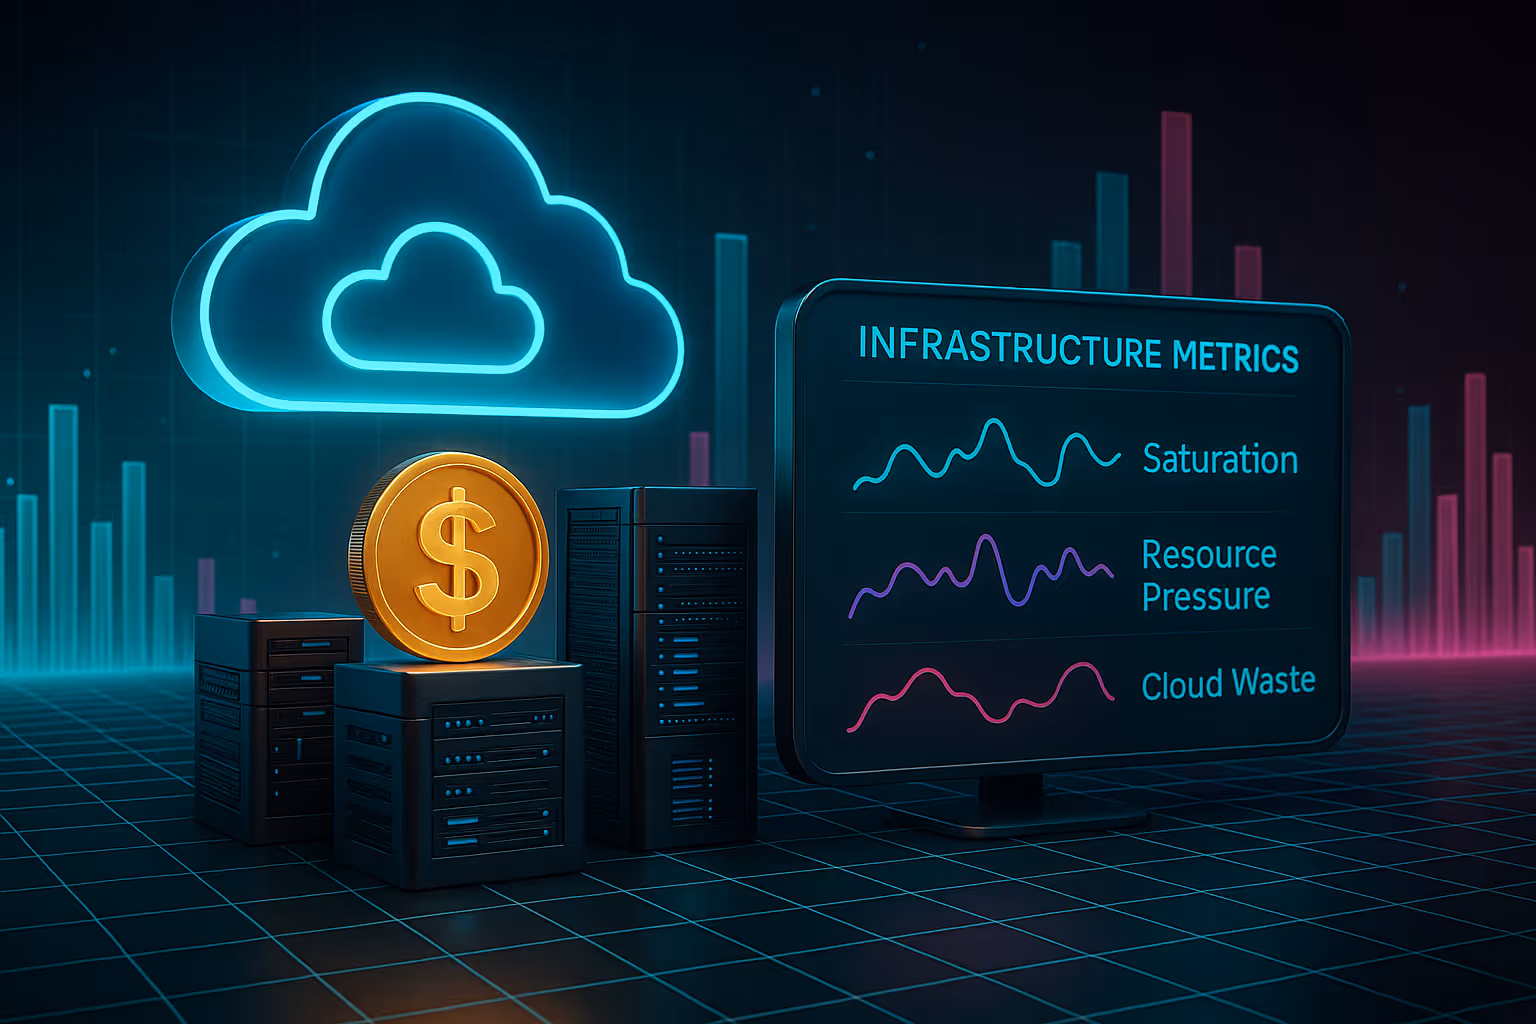
1. Saturation (System Resource Pressure)
Saturation measures how heavily your compute resources are being used, specifically CPU, memory, or thread pools, across EKS nodes or EC2 instances. When these reach high usage, the system can’t keep up with new workload requests.
For better understanding, if your nodes are running close to full capacity, say >85% CPU or low available memory, Kubernetes can start evicting pods, throttle workloads, or fail to schedule new pods. This directly affects service reliability. In high-traffic environments, like payment gateways or checkout services, high saturation usually leads to latency spikes, timeouts, or failed transactions.
According to DORA, saturation is a key metric tied to system availability and operational performance.
2. Infrastructure Drift & Change Frequency
Moving from saturation metrics to infrastructure drift, it’s important to measure how often infrastructure changes are made outside your Infrastructure-as-Code (IaC) pipeline. Drift refers to any shift in cloud resources that isn’t tracked in your Terraform state, which is usually caused by manual edits in the AWS console, scripts, or misconfigured automation.
Take this scenario: Terraform config defines an EKS node group using t3.large instances of AWS. Someone from the team, while debugging a capacity issue, updates the node group's Launch Template in the AWS GUI to use m5.large instead.
The next time you run [.code]terraform apply[.code], Terraform sees this as a drifted resource. Since the instance type now differs from what’s defined in the module, Terraform attempts to recreate the entire node group with the original t3.large setting. This triggers a replacement of all nodes in that group, causing:
- Kubernetes to drain the running pods from old nodes (gracefully or forcefully, depending on readiness probes and pod disruption budgets).
- Pods scheduled on the new nodes may fail if the required ENIs, IAM roles, or daemonsets aren’t set up identically.
- Auto-scaler policies tuned for [.code]m5.large[.code] performance now behaves unpredictably under [.code]t3.large[.code].
- If your workload uses EBS volumes with instance-store-backed nodes, you may also lose ephemeral data.
- HorizontalPodAutoscaler (HPA) behavior may break due to different CPU performance baselines.
Even worse, if your GitLab CI/CD pipeline runs [.code]terraform plan[.code] and doesn’t explicitly check for drift, this replacement happens during a routine deploy, causing a partial cluster outage without clear warnings. In our case, it led to 502 errors at the ingress and impacted order processing for 30 minutes.
And if Terraform isn’t run regularly, say, for 10 days or more, these drifted resources remain in a mismatched state, increasing risk. However, Firefly gives you this capability out of the box by continuously scanning your cloud environment and Terraform state for drift, so you don’t have to reinvent the wheel when it comes to drift detection and remediation.
Here’s a snapshot from the Firefly Inventory dashboard, showing a detailed view of your cloud assets:
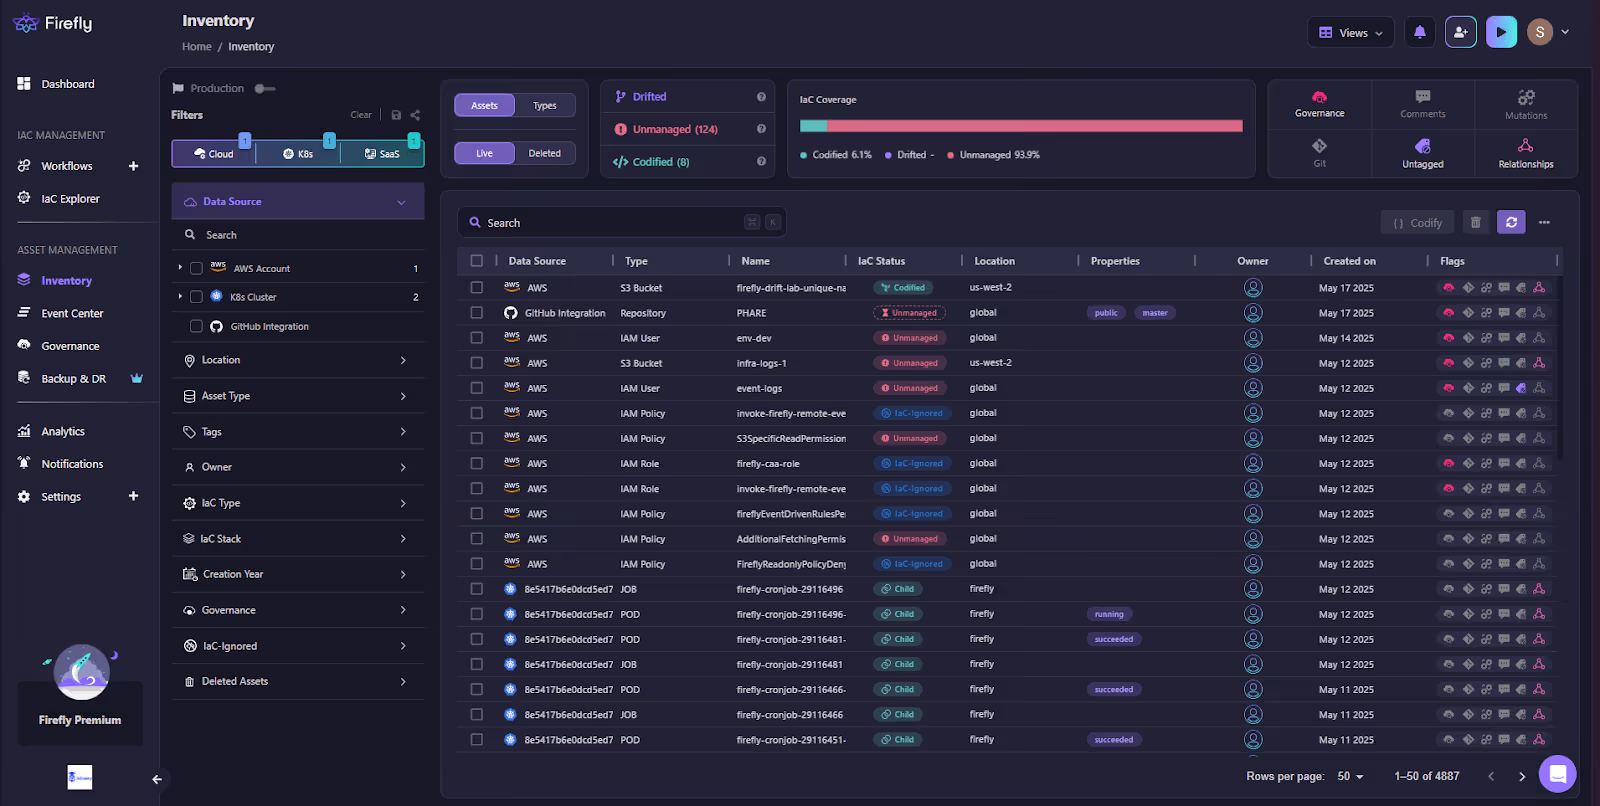
This immediate visibility of your infrastructure lets you remediate drift before it triggers unexpected downtime or costly replacements. Firefly also offers Slack integration, providing automatic updates about any drifts occurring in your cloud. This way, you won't need to check your dashboards again.
3. Latency Percentiles (Not Just Averages)
Measures response times at specific percentiles like p95 and p99, not just average latency. These values show the slowest request when the Redis cache (used for session tokens) misses, the API falls back to a slow database query. It only affects a few requests, but those users are stuck waiting.
If you had only tracked average latency, this issue would’ve stayed hidden.
4. Cloud Waste Metrics
Cloud waste happens when you’re paying for resources that aren’t doing useful work or are misconfigured in a way that inflates your bill and risks stability. This includes idle instances running at low CPU, unattached EBS volumes, orphaned IPs, or load balancers that spin up more capacity than needed.
For example, your autoscaler might react to a spike in traffic by launching many instances, but if those instances sit idle most of the time or your scaling rules are too aggressive, you’re burning money on unused capacity. Similarly, leftover storage volumes that aren’t attached to any instance keep accumulating charges without adding value.
This waste also ties directly into reliability. Bursty workloads caused by inefficient autoscaling or repeated retries from backend errors increase cost and make troubleshooting harder.
Firefly’s Analytics dashboard shows these problems in detail. It tracks where cloud spend is going, highlights underutilized or orphaned resources, and links those to error patterns or configuration issues. This lets you pinpoint exactly what’s causing cost spikes and wasted resources, so you can clean up aggressively without risking service availability.
Here’s what you’d see in Firefly:

It tracks 1.0k resources for waste, identifies 588 untagged assets, and highlights $0.16 in cloud waste costs. The dashboard also flags 127 critical violations and tracks shifts in resource usage over time. With this analysis, Firefly helps you address inefficiencies, control costs, and ensure service reliability.
5. MTTR & MTTD
MTTD (Mean Time to Detect) tells you how long it takes for your team to notice a problem after it starts. MTTR (Mean Time to Resolve) tells you how long it takes to fully fix that problem once it’s been detected.
Both of these metrics are some of the most underrated tools for assessing the effectiveness of your monitoring and incident response processes.
Let’s say a production PostgreSQL RDS instance starts hitting high CPU usage above 85%. This could be caused by a specific query pattern from the frontend that’s scanning too many rows without an index. If you haven’t set up an alert in Prometheus that checks average CPU usage for that database, it might take 30 minutes or more before anyone notices. During that time, requests from your app to the database start backing up. As a result, users might see very slow responses and get errors while using the application.
Now, once someone on your team does notice the alert, if there's no documented troubleshooting process for high RDS CPU usage, the engineer might waste time checking logs, guessing at causes, and trying random changes. A better approach would be to have a clearly written step-by-step response: check slow query logs in CloudWatch, look for missing indexes, and if needed, temporarily scale up the instance or drop traffic from non-critical reporting jobs.
To track MTTD and MTTR, use incident management tools like PagerDuty or Opsgenie to log the exact start and end times of incidents. This data helps calculate how quickly issues are detected and resolved. In Prometheus, set up alerts on critical resources such as your RDS instances, like one that will notify the team when the CPU goes above 80%, giving them a chance to act before it becomes a full outage.
6. Disk I/O and Storage Latency
Disk I/O latency measures how long it takes to complete read or write operations on storage volumes. In AWS, this typically means tracking EBS metrics like VolumeReadLatency and VolumeWriteLatency. For S3, latency is harder to monitor directly and is usually inferred from application-level performance metrics. High latency usually indicates disk contention, exhausted IOPS credits, or storage misconfiguration, and it will slow down any system that depends on fast disk access, including databases, queues, and application servers.
This matters because even if your CPU and memory are healthy, your application can still crawl if the underlying storage is slow. For example, your API might fetch user data from a database that depends on fast disk reads. If read latency on the EBS volume spikes, queries start to lag, and users begin to see timeouts or long page loads. In microservice environments where databases, caches, and queues all rely on persistent volumes, unmonitored storage latency becomes a silent bottleneck.
In one production case, we saw 50ms average read latency on an EBS volume backing PostgreSQL in prod-payments-eks. This was caused by burst credit exhaustion on a GP2 volume. The result: around 20% of queries were delayed, and key endpoints like /transactions and /payouts saw response times degrade. Since we had no latency alert configured, the issue wasn't caught for nearly an hour, and users were already impacted by the time engineering got involved.
To catch this earlier, you should monitor storage latency just like any other core infrastructure metric. In CloudWatch, track AWS/EBS/VolumeReadLatency and VolumeWriteLatency. In Prometheus, use aws_ebs_volume_read_latency_average and alert when latency exceeds 10ms.
Don’t wait for users to give feedback. Set up disk I/O and storage latency alerts alongside CPU and memory. It’s often the root cause of slow databases and flaky services, especially in production environments with unpredictable workloads.
7. Network Saturation & Retransmits
Network saturation and TCP retransmit rates measure how well your network is handling traffic within your VPC or through load balancers like an ALB. High retransmit rates indicate packet loss, which often results from network congestion, hardware issues, or noisy neighbors competing for bandwidth.
Packet loss and saturation cause requests to time out and degrade overall application performance, especially for latency-sensitive services.
For example, we observed a 10% TCP retransmit rate on our ALB, which pointed to a noisy neighbor issue in the same availability zone. We identified this using VPC flow logs and network metrics.
To monitor this, track metrics like [.code]AWS/ELB/TCP_Client_Reset_Count[.code] in CloudWatch or [.code]node_network_transmit_errs_total[.code] in Prometheus. Set alerts when retransmission rates exceed 5%. Early detection of rising retransmits helps prevent network-related timeouts and keeps your services responsive.
Turning Raw Metrics into SLO-Backed Signals
Most infrastructure teams monitor raw metrics like CPU usage or memory consumption, but these numbers often fail to capture what users actually experience. A metric like “Database CPU < 70%” might sound healthy to engineers, but it tells you nothing about whether your app feels fast or reliable to users. That’s where Service Level Indicators (SLIs) and Service Level Objectives (SLOs) come in. They translate noisy system metrics into actionable, user-focused signals.
Instead of monitoring infrastructure for its own sake, SLOs help teams measure what matters: “Are we fast enough? Are we available enough?” For example, a meaningful latency SLO could be: “99% of SELECT queries complete in under 100ms over 28 days.” This ties backend behavior directly to the quality of service your customers feel. You can express this using PromQL, or define it declaratively with tools like Sloth, which lets you generate Prometheus SLOs via YAML, or use platforms like Nobl9 that support multi-source SLO management and alerting.
Monitoring raw metrics and defining SLOs are crucial for your infrastructure, but the real value comes from putting these into practice with automated alerts that notify you before problems impact users. For DevOps teams, disk I/O latency on EBS volumes is a common bottleneck that can silently degrade database and application performance.
To ensure you catch these issues early, the next example walks through how to set up a Terraform-managed CloudWatch alarm for EBS read latency. This practical approach helps you move from theory to action, automating the detection of storage latency spikes so you can respond quickly and keep your systems healthy.
How to Monitor and Alert on EBS I/O Latency Using Terraform
High I/O latency on Amazon EBS volumes measured by metrics like [.code]VolumeTotalReadTime[.code] and [.code]VolumeReadOps[.code] or the number of read operations can silently degrade application performance, especially when these volumes back latency-sensitive workloads like PostgreSQL, MySQL, or MongoDB running on EC2 instances. Instead of reacting after users report slowness, you can proactively monitor EBS read latency and trigger alerts using CloudWatch, all provisioned via Terraform for automation and consistency.
Firefly: Monitor Infra Drift, Changes, and Cost Without Manual Guesswork
Firefly focuses on the core metrics that actually impact your infrastructure — like saturation, configuration drift, latency spikes, and error budget burn. Tracking these with precision cuts incident response time by 40% and reduces downtime by 25%. Firefly collects telemetry across your cloud accounts and IaC state, then surfaces exactly which resources have drifted and how that affects your cloud spend.
The dashboard below shows real-time data from Firefly’s Unified Drift & Cost view. You can immediately see how many resources are unmanaged or drifted, spot assets with high-severity violations, and understand the dollar impact of cloud waste down to resource type, like AWS GP2 EBS volumes.

This tight integration of drift detection and cost visibility lets teams quickly prioritize remediation efforts, reduce unexpected cloud charges, and prevent outages caused by hidden infrastructure issues.
What’s Next? How Do You Help Your Boss Make Sense of What You’re Tracking?
Tracking the right metrics, but still not sure how to translate the value of cloud to your boss, your execs, and your board? Download our Value of Cloud slide template to start proving the value you’re creating.
.webp)


.webp)


