
In 2025, cloud infrastructure management has very little to do with uptime. Uptime is the baseline. The real work is making sure every change is cost-visible, compliant, secure, and doesn’t leave hidden drift for the platform team to clean up later.
This isn’t theory. As Fortune reported in May 2025, Daniel Chait (CEO of Greenhouse) described cloud security as a 24/7 job. That resonates with anyone who’s run production environments. Configs that are locked down today can be exposed tomorrow if guardrails aren’t baked into the workflow. (Fortune)
Here’s how this plays out day to day: you push a Terraform change for a new service, the plan runs, and it quietly slips through with an S3 bucket missing encryption or a security group open to the world. The reviewer skims the PR, focusing on application logic rather than low-level infrastructure details, and thus merges it without a second thought. A week later, finance is chasing a cost anomaly or the security team is scrambling to explain the misconfiguration during an audit..
That’s the gap. If your workflow doesn’t enforce compliance, tagging, and cost checks before applying, you’ll always find out the hard way, when the bill spikes, when drift sneaks in, or when an auditor asks questions you can’t easily answer.
Gartner is blunt about the consequence: by 2028, 25% of organizations will be disappointed with their cloud results, not because AWS or GCP failed them, but because governance and cost visibility weren’t there. I’ve seen this firsthand: teams move fast, infra sprawls, and suddenly the platform team is half firefighting, half writing one-off scripts just to hold things together.
This playbook walks through how to manage cloud infrastructure end to end: setting up the right foundations, managing changes safely with IaC and policy guardrails, wiring observability back to deployments, and making cost and compliance part of the daily workflow. The goal is to run cloud environments that stay secure, cost-efficient, and audit-ready as they scale.
We’ll then walk through a service lifecycle end to end and close with how Firefly pulls these threads into a single control plane, replacing the brittle scripts most of us still rely on.
What Cloud Infrastructure Management Really Means
Cloud infrastructure isn’t just VMs and storage. It’s networks, service accounts, IAM roles, secrets, and the monitoring systems that tell you when something’s broken. Managing it means handling the full lifecycle: provision it with code, enforce secure defaults, patch and back up on schedule, watch for drift, right-size resources, and tear things down cleanly when they’re no longer needed.
When you don’t manage it this way, the problems show up fast:
- Config drift occurs when the running environment no longer matches what’s in Git.
- Wasted spend from forgotten clusters, idle VMs, or oversized databases.
- Security exposure from overly broad IAM roles, open security groups, or missing encryption.
- Painful audits because logs, policies, and evidence aren’t collected automatically along the way.
At Microsoft scale, 98% of IT in Azure across 1,400+ subscriptions and thousands of workloads, they had to move off legacy datacenter tooling and onto Azure-native controls. Azure Monitor replaced SCOM for telemetry, Update Management took over patching, Backup/Recovery vaults cover petabytes of data, and Azure Policy enforces things like region restrictions, encryption, and network boundaries. Ownership of resources sits with individual service lines, but guardrails and visibility are centralized so teams can move quickly without breaking compliance.
A well-run setup in 2025 looks like this:
- Conduct continuous inventory and drift checks to ensure live resources always match IaC.
- Guardrails codified as policy encryption, private networking, allowed SKUs, mandatory tags, and baseline IAM.
- Automated patching and tested backups with alerts when something fails.
- Telemetry is tied directly to deployments, so incidents map back to the exact change and owner.
- Cost checks in the workflow include estimates in PRs, budget alerts, and ongoing right-sizing.
That’s what “infrastructure management” really means now. Not a ticket queue, but a system of automated checks, policies, and feedback loops that keeps the environment consistent, secure, and cost-efficient as it grows.
The Cloud Stack You’re Managing
So once you understand what “infrastructure management” really means in practice, owning the lifecycle, avoiding drift, keeping costs visible, and baking in compliance, the next question is: what exactly are you managing?
It isn’t a single layer. Cloud environments today are a mix of raw infrastructure, managed services, and SaaS platforms. Each comes with different boundaries of control, and if you don’t recognize those differences, you’ll end up with blind spots.

IaaS (Infrastructure-as-a-Service)
This is the raw layer: VMs, disks, and VPCs/VNets. Here you own almost everything: OS patching, firewall rules, backup jobs, IAM bindings, and even network routing. If drift happens here, it usually means a misconfigured security group, an unpatched image, or forgotten volumes that keep billing. The tradeoff is maximum flexibility, but it comes with maximum responsibility.
PaaS (Platform-as-a-Service)
Here you’re consuming managed services, Kubernetes clusters, databases, queues, pub/sub, etc. The provider handles uptime and patching of the platform, but you own the configs and guardrails. If you misconfigure a PaaS DB without backups or leave a K8s cluster without network policies, the provider won’t save you. At scale, most drift here is config-related: someone toggles a setting in the console that isn’t in IaC.
SaaS (Software-as-a-Service)
These are external platforms: GitHub, Datadog, Okta, PagerDuty, and dozens more. You don’t touch the infra at all, but governance still matters: who has admin rights, which roles exist, which webhooks or integrations are enabled. I’ve seen SaaS misconfigurations, like a wide-open GitHub org or stale Okta users, cause just as much impact as a misconfigured VPC.
The key point: as you move up the stack, the amount of infra you directly control shrinks, but the need for visibility, policies, and drift control doesn’t go away. If anything, the risk just shifts: IaaS drifts in network/security, PaaS drifts in configs, SaaS drifts in identity and access.
Core Foundations (Day-0 Decisions)
Before you start spinning up workloads, you need the scaffolding. These are Day-0 decisions that define how everything runs. If you skip them, you’ll be cleaning up IAM sprawl, untagged resources, and broken org structures for years.
Landing Zones & Org Setup
A landing zone is the baseline layout for your cloud accounts. In AWS, a common setup is:
- A shared services account for logging, monitoring, and IAM federation.
- Separate prod, staging, and dev accounts to isolate blast radius.
- A security account where GuardDuty/CloudTrail/KMS are centralized.
Azure and GCP follow the same pattern with Management Groups/Folders and Subscriptions/Projects. Example: instead of dumping every workload into a single AWS account, you put your production K8s cluster in its own account, staging in another, and enforce org-level Service Control Policies (SCPs) that prevent things like creating resources outside approved regions. That way, developers can’t “accidentally” launch resources in random regions with no backups.
Identity & Access (IAM)
IAM is where things get ugly fastest if you don’t set rules. Example: Instead of giving developers permanent AdministratorAccess, you issue short-lived roles via SSO (AWS SSO or Azure AD) with MFA enforced. Engineers can request a 1-hour admin session through an approval workflow, and everything is logged.
For workloads, don’t let apps run on hardcoded keys. In AWS, run them on an EC2 instance role or an IAM Role for Service Accounts (IRSA) in EKS. In GCP, bind a service account to the GKE workload. In Azure, use Managed Identities. That way, rotation is automatic and secrets don’t leak into repos.
Governance via Tags/Labels
Tags are what let you tie spend and compliance back to teams. Example: you enforce four mandatory tags on every resource, environment, owner, cost-center, and data-class.
- An EC2 instance without owner can’t be launched (blocked by an SCP).
- In Azure, a VM missing cost-center fails the policy check.
- In GCP, backups can be auto-applied only to resources tagged data-class=confidential.
Without these, your billing CSV just says “EC2-0001234,” and good luck explaining that to finance. With enforced tagging, you can tell finance exactly which team owns which spend, and you can also enforce security policies that depend on data classification.
Provisioning and Change Management
Once the foundations are in place, including your org structure, IAM guardrails, and tagging strategy, the next challenge is how infrastructure is actually deployed and changed. This is where most teams trip up: the foundations are solid, but changes still sneak in through the console or emergency fixes, and drift creeps back in. The goal here is simple: every infrastructure change should be reviewed, tested, compliant, and recoverable.
1. Infrastructure as Code (IaC)
IaC isn’t just about writing Terraform or Pulumi; it’s about how you structure and operate it.
- Use modules so teams don’t reinvent S3 buckets or VPCs differently every time.
- Secure your state (AWS S3 + DynamoDB lock, GCP Cloud Storage + Firestore, Azure Storage + Blob locks). State exposure is a real attack surface.
- Treat modules like software: version them, test them, and publish them internally.
Example: Instead of each team creating their own RDS database with ad-hoc configs, you provide a db-module with encryption, backups, and logging enforced. Teams just consume it, no chance to “forget” the guardrails.
2. GitOps
Treat Git as the source of truth, not the console.
- Pull requests trigger plans.
- Merges trigger applies.
- A controller (e.g., ArgoCD, Flux) reconciles the live state to what’s in Git.
If someone clicks around in the console and changes a security group, GitOps notices the drift and reverts it. In EKS, ArgoCD syncs manifests, whereas in Terraform, Atlantis or Spacelift runs plans on PRs and enforces merges before apply. This kills drift at the root.
3. Policy-as-Code
Guardrails can’t live in a wiki. They need to run in pipelines.
- OPA/Conftest or Terraform Sentinel can enforce policies such as “all buckets must be encrypted,” “no security group with 0.0.0.0/0,” or “all resources must have owner and environment tags.”
- CI/CD pipelines run these checks before a change ever hits the cloud.
Example: a developer tries to deploy an S3 bucket without encryption. The plan fails in CI with a clear error: “Bucket must have server-side encryption enabled (org policy).” The change never even makes it to production.
Observability Across Infrastructure and Deployments
After you lock down provisioning, you need clear sightlines across apps and infra, and a way to tie every signal back to a change. Collect metrics, logs, and traces across services and platforms, then correlate them with deployments and ownership. That’s what lets you go from alert → root cause → fix in minutes.
1. OpenTelemetry Everywhere
Standardize on OpenTelemetry so telemetry looks the same across languages and runtimes.
- SDK + Collector: instrument services with OTel SDKs; run an OTel Collector per node/cluster (receivers: OTLP/HTTP, Prometheus; processors: batch, tail-sampling; exporters: your APM or TSDB).
- Required resource attributes: service.name, service.version, deployment.environment, git.sha, team, region. Add domain keys like tenant_id or order_id sparingly.
- Traces you can work with: propagate context (W3C traceparent) through gateways, queues, and async workers; tag spans for DB calls, external APIs, and cache hits to isolate latency sources.
- Sampling: head sampling at 1–5% for high-QPS services, with tail-sampling policies to keep slow/error traces at 100%.
Result: When latency increases by 300 ms, the trace indicates that the issue is with the DB span after git.sha=7e3f21, not the API thread pool.
2. Kubernetes Monitoring
K8s needs its own view in addition to app telemetry.
- Signals: RED (Rate, Errors, Duration) for service endpoints; USE (Utilization, Saturation, Errors) for nodes and critical resources.
- Collectors: Prometheus Operator + kube-state-metrics + node exporter. Scrape pod annotations by default; ship to Thanos/Mimir/VictoriaMetrics or your vendor backend.
- Dashboards: per namespace and per workload, requests vs limits, HPA status, restarts, 95p/99p latency.
- Alerts that matter:
- CrashLoopBackOff > N/min (gate on deployment in-progress to avoid noise)
- HPA at 90%+ for 15 min
- Pod pending due to unschedulable (taints/affinity)
- Error rate burn (see SLOs below)
This catches rollout-induced failures and capacity issues fast, not after users notice.
3. Deployment Metadata & SLOs
Make telemetry change-aware and reliability-driven.
- Annotate everything: push deploy events (commit SHA, PR, image tag, author, service owner) into your metrics backend; label traces/metrics with the same fields. Dashboards show a vertical line at deploy time.
- SLOs as first-class: define per-service SLOs (e.g., 99.9% success, 95p latency < 200 ms). Use multi-window, multi-burn-rate alerts (e.g., 2% over 1h and 5% over 5m) to page only when you’re burning budget meaningfully.
- Automated responses: failed SLO burn → trigger rollback/canary halt (Argo Rollouts/Spinnaker) and open a ticket with the offending git.sha. Tie alerts to runbooks.
Observability only pays off when it connects signals to ownership. Metrics, logs, and traces on their own are noise; when you layer in deployment metadata, audit logs, and SLOs, you get a clear picture of what broke, who owns it, and whether you’re still within error budget. That’s how you shorten incident MTTR and make reliability measurable instead of anecdotal.
With that visibility in place, the next step is to make sure the underlying infrastructure itself is secure, resilient, and built on proven defaults.
Security, Network, and Resilience
Observability helps you find issues fast, but you still need to design the environment so mistakes don’t spread and recovery is predictable. This comes down to three areas: network layout, security defaults, and tested recovery.
1. Network design
Keep environments isolated and traffic controlled.
- Segmentation: Use a hub-and-spoke model. Shared services (logging, identity, outbound egress) live in the hub. Workloads sit in separate spokes for prod, stage, and dev. No cross-env routing unless explicitly approved.
- Ingress: Only through load balancers, API gateways, or ingress controllers. Attach a WAF where possible. Don’t assign public IPs to VMs or pods unless there’s a strong business need.
- Egress: Force traffic through NAT or firewalls with allowlists. In AWS, use VPC Endpoints; in GCP, Private Service Connect; in Azure, Private Endpoints. Block direct internet paths if a private endpoint exists.
- East-west: Enforce Network Policies in Kubernetes and security groups/NSGs for VMs. Default deny, then allow only the flows you expect.
- Encryption in transit: Use TLS everywhere. For service-to-service traffic, use a service mesh (Istio, Linkerd) or mTLS sidecars.
2. Security defaults
Make insecure options impossible.
- Identity: Enforce SSO with MFA for humans. No long-lived IAM keys. For workloads, use IAM Roles (AWS IRSA, GCP Workload Identity, Azure Managed Identity). Rotate automatically.
- Keys and secrets: Encrypt all storage with KMS-managed keys. Separate keys by environment. Store secrets in a vault (AWS Secrets Manager, GCP Secret Manager, Azure Key Vault). Rotate database creds or move to IAM-based auth.
- Images and patching: Build hardened base images and update them regularly. Use admission controls to block unapproved container images. Automate patching through Update Management or similar tools.
- Policies: Apply org-level policies to block unencrypted buckets, prevent 0.0.0.0/0 on admin ports, enforce tags/labels, and restrict regions. Run these checks both in CI and continuously in the control plane.
3. Resilience and recovery
Failures are guaranteed; design for them.
- Multi-AZ: Deploy workloads across at least two availability zones. Use managed HA databases with automatic failover (RDS, Cloud SQL, Azure SQL).
- Scaling and limits: Configure autoscaling with safe minimums. Add sensible timeouts and retries with jitter to prevent cascading failures.
- Backups: Define RTO/RPO for each service. Use PITR for databases and replicate backups across regions. Store them immutably (e.g., S3 Object Lock).
- Testing: Run restore drills quarterly. Spin up from backups in a clean environment and measure actual restore time. If you miss the RTO, fix the process.
- Runbooks: Automate where possible. DR plans should be scripts or IaC runs, not PDFs buried in Confluence.
In short: isolate networks, enforce least privilege by default, encrypt everything, and prove your backups work. With these basics covered, the next challenge is keeping costs visible and turning them into engineering metrics instead of finance surprises.
Cost Management and FinOps in Practice
Treat cost as an engineering signal. Make it visible in the same places you review reliability and security, and enforce it in the same pipelines.
1. Shift-left costs
- PR checks: Run a cost estimator (e.g., Infracost or a provider calculator) in CI for every Terraform/Pulumi change. Show the monthly delta next to the plan.
- Policy gates: Fail the pipeline if the PR pushes the service over its budget or introduces unapproved SKUs/instance families.
- Budgets & alerts: Set project/team budgets with alerts at 50/80/100%. Send alerts to Slack/Jira with the diff (top services, regions, SKUs).
2. Ownership
- Mandatory tags/labels: owner, team, service, environment, cost-center. Deny resource creation without them (SCP/Org Policy/Azure Policy).
- Kubernetes allocation: Propagate labels from namespaces to workloads; use a cost allocation tool (e.g., Kubecost/OpenCost) so node, PV, and LB costs roll up to services and teams.
- Billing exports: Enable detailed exports (AWS CUR → Athena, GCP Billing → BigQuery, Azure Cost Management exports) for reliable reporting and anomaly queries.
3. Optimization
- Compute rightsizing: Target p95 CPU 40–60% and memory 60–75%. Drop instance sizes or K8s requests/limits when consistently below target. Example: m5.4xlarge → m5.2xlarge saves ~40–50% if headroom remains acceptable.
- Autoscaling & schedules: Enable cluster/node autoscaling. Stop dev/test VMs and scale non-prod clusters to zero outside working hours.
- Purchasing strategy: Use Savings Plans/Reservations (AWS), CUDs (GCP), or Reserved Instances (Azure) for steady baseload only; keep burst workloads on on-demand. Rebalance commitments monthly.
- Spot/preemptible: Move stateless, retry-safe workloads to Spot/Preemptible nodes with PDBs, disruption budgets, and queue depth controls.
- Storage:
- Enforce lifecycle policies (S3 → IA/Glacier, GCS → Nearline/Coldline/Archive, Azure → Cool/Archive).
- Convert gp2 → gp3 (AWS) to cut EBS cost without IOPS loss; delete unattached volumes and stale snapshots.
- Tier logs to cheaper storage after N days; keep only what audits require.
- Networking:
- Minimize inter-AZ and cross-region traffic; co-locate chatty services.
- Use private endpoints to avoid egress to public endpoints where applicable.
- Clean up idle load balancers, elastic IPs, and NAT gateways where architecture allows (consider NAT instance vs. gateway trade-offs carefully).
- Services: Turn off idle managed services (queues, functions, caches) and scale down DB replicas in non-prod.
KPIs
Track cost like you track SLOs:
- Unit cost: cost per request, job, or active user per service.
- Coverage: % of spend with valid tags/labels; % of infra under IaC with cost checks.
- Efficiency: commitment coverage %, Spot/Preemptible share, idle rate (low-utilization spend).
- Budget health: variance vs. monthly budget and anomaly count/time-to-triage.
With cost controls wired into CI, tagging enforced, and regular right-sizing in place, the next step is keeping compliance continuous, so audits rely on evidence you already generate, not last-minute spreadsheets.
Compliance and Audit Readiness Without the Pain
You don’t “prepare for audits.” You design your workflows so that compliance evidence is produced automatically as part of day-to-day operations. When audit season comes around, you’re pointing to artifacts you already have, not scrambling for screenshots and spreadsheets. The key areas to cover are:
1. Map controls once, reuse everywhere
- Build a simple control library (e.g., spreadsheet or YAML) that maps your policies to key frameworks, including SOC 2, ISO 27001/27701, NIST CSF, and CIS Benchmarks.
- For each control, record the following: owner, test method (preventive/detective), evidence source, retention, and exceptions process.
Example (CIS storage encryption):
- Policy: All object storage is encrypted with KMS keys.
- Preventive: AWS/Azure/GCP org policies block unencrypted buckets.
- Detective: Daily CSPM query (Config/Policy/ SCC / Security Hub) to list violations.
- Evidence: Policy-as-code repo, CI logs, provider policy reports, and daily export to an evidence bucket with WORM.
2. Preventive controls in pipelines
- IaC checks: OPA/Conftest, tfsec/Checkov, kube-score/kube-linter. Fail PRs for: public buckets, 0.0.0.0/0 on admin ports, no backups, missing tags, no TLS.
- Cost/compliance gates: Block merges if a change violates policy or pushes the service beyond cost or data-class rules.
- Image policy: Admission control (Pod Security Admission/OPA Gatekeeper/Kyverno) to require signed, non-root, pinned images.
Result: Non-compliant resources never reach the cloud.
3. Detective controls in the cloud
- Cloud policy engines: AWS Config + Security Hub, Azure Policy + Defender for Cloud, GCP Security Command Center + Org Policy. Enable org-wide assignments.
- Continuous scans: Run daily/continuous checks for CIS/NIST rules, identity drift (new admin roles), open ingress, disabled backups, and unmanaged public endpoints.
- Auto-remediation: For low-risk fixes (e.g., missing bucket encryption), attach remediation runbooks (Lambda/Functions/Cloud Run jobs). Everything opens a ticket with the owner + deadline.
4. Evidence you already generate
- Change history: PRs, reviews, CI logs, Terraform plans/applies, Kubernetes rollout history.
- Runtime posture: Policy evaluation reports from cloud providers and CSPM, vulnerability scan results, backup/restore logs, and patch compliance.
- Access records: SSO audit logs, privileged elevation approvals, break-glass usage with reason codes.
- Data plane logs: Audit logs (CloudTrail/Activity log/Cloud Audit), WAF/firewall logs, DB audit logs.
Ship all of the above to a central “evidence” bucket/project with:
- Retention: ≥ 1 audit cycle (often 13–18 months).
- Immutability: Object Lock/WORM where required.
- Index: Minimal catalog (what, when, where) so auditors can self-serve.
5. Proving backups and patches (the usual audit traps)
- Backups: Quarterly restore tests per tier, recorded RTO/RPO vs target, signed results stored as evidence.
- Patching: Monthly patch SLAs by severity; export compliance per environment, and attach exceptions for systems awaiting vendor fixes.
6. Exceptions and data classification
- Data classes: public/internal/confidential/restricted drive policies (encryption, private endpoints, residency).
- Exception workflow: time-boxed, approved in a ticket with compensating controls; auto-expire and notify before lapse.
7. Minimal auditor runbook
When asked for a control, the response should be mechanical: show the policy-as-code in Git (commit hash), link the CI gate that enforces it, provide cloud policy results for the requested period, and include any exceptions with approvals and expiry dates. For DR or patching, hand over the last restore test or patch compliance report with real metrics.
With compliance embedded in pipelines and enforced continuously in the cloud control plane, audits become a matter of referencing artifacts, not building slide decks. Next, we’ll set the operating rhythm and metrics that keep this posture from drifting over time.
Operating Rhythm and Metrics
Having policies, guardrails, and evidence pipelines in place isn’t enough—you need a regular cadence to make sure everything stays healthy. Drift, cost creep, and exceptions all pile up if you don’t review them on a schedule. Think of this as the “heartbeat” of infrastructure operations.
1. Cadence
- Weekly: Triage drift reports, failed compliance checks, and cost anomalies. Assign owners and close the loop fast so issues don’t linger.
- Monthly: Posture review at the team level, look at cost vs. budget, policy violations, and security findings. This is where you decide what to remediate vs. what to file as a tracked exception.
- Quarterly: Run Well-Architected reviews (AWS/Azure/GCP) or equivalent deep dives. Confirm backup restores work within RTO, rotate keys/secrets where required, and verify disaster recovery drills.
2. Metrics
Track a small set of metrics that show whether infra is under control:
- % of resources under IaC management (vs. manually created).
- Drift mean-time-to-acknowledge (MTTA) is how long drift sits before someone picks it up.
- Policy compliance rate of resources passing org-level policies.
- Backup restore success and duration are not just measured by the existence of backups, but also by whether restores meet RTO/RPO.
- Cost per unit of work, e.g., cost per 1k requests, cost per active user, or cost per pipeline run.
3. Continuous improvement
Use the outputs of these reviews to feed back into your platform backlog. If drift detection is noisy, improve automation. If tagging coverage is low, add stronger policy enforcement. If restore drills are slow, consider changing the tooling or architecture. The goal is to reduce manual toil release by release, until the rhythm becomes predictable and repeatable.
Firefly, From Principles to Practice
All the practices so far, inventory, drift detection, IaC guardrails, cost visibility, evidence pipelines, work only if they’re applied consistently across clouds, services, and teams. In most orgs, that consistency breaks down. Terraform runs live in one repo, drift scripts in another, tagging policies in a wiki, and SaaS configs aren’t governed at all. Platform teams spend half their time wiring brittle scripts together instead of managing infra.
Firefly acts as a control plane overlay that makes the principles we’ve covered operational. It discovers, codifies, and governs resources across AWS, Azure, GCP, Kubernetes, and SaaS like GitHub, Okta, and Datadog, putting them under one lifecycle.
The Gaps in Cloud Infrastructure Management
- IaC (Terraform/OpenTofu/Pulumi) only covers part of the estate; drift scripts are ad-hoc and noisy.
- Cost checks happen late, in spreadsheets, not inline in pull requests.
- Compliance evidence is scraped together at audit time instead of being generated continuously.
- SaaS platforms remain unmanaged: admins, roles, and configs drift silently.
- Each team patches the gaps differently, no standardization, no scale.
This is why infra “works” on paper but fails under audit, scale, or cost review.
A Unified Control Plane for Infrastructure
Firefly consolidates what was previously scattered:
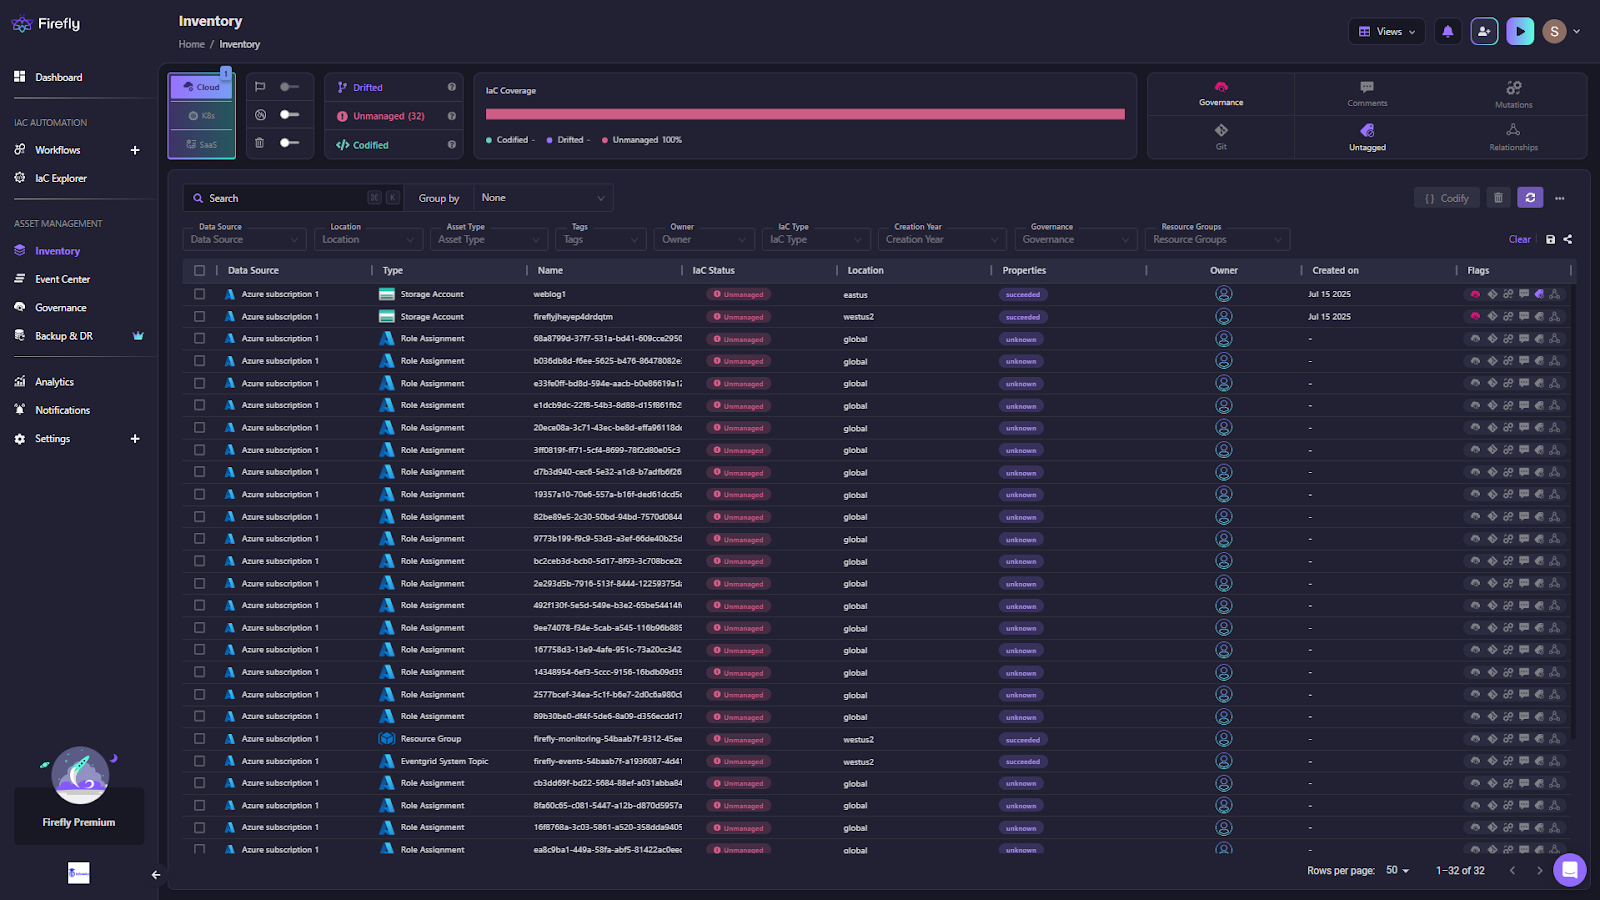
- Dashboard: As shown below Real-time view of estate counts, tagging coverage, compliance packs, projected savings, and ClickOps events. This replaces “spreadsheet posture” with live metrics.

- Inventory with IaC awareness: Every resource is labeled as Codified, Drifted, Unmanaged, or Ghost. You can filter by provider, type, owner, or tag to target cleanup.
- Codify unmanaged resources: Select any ClickOps resource and generate Terraform/OpenTofu with sane defaults (versioning, encryption, lifecycle). Commit it back as a PR. Here’s how the unmanaged Azure Storage Account weblog1 is codified:
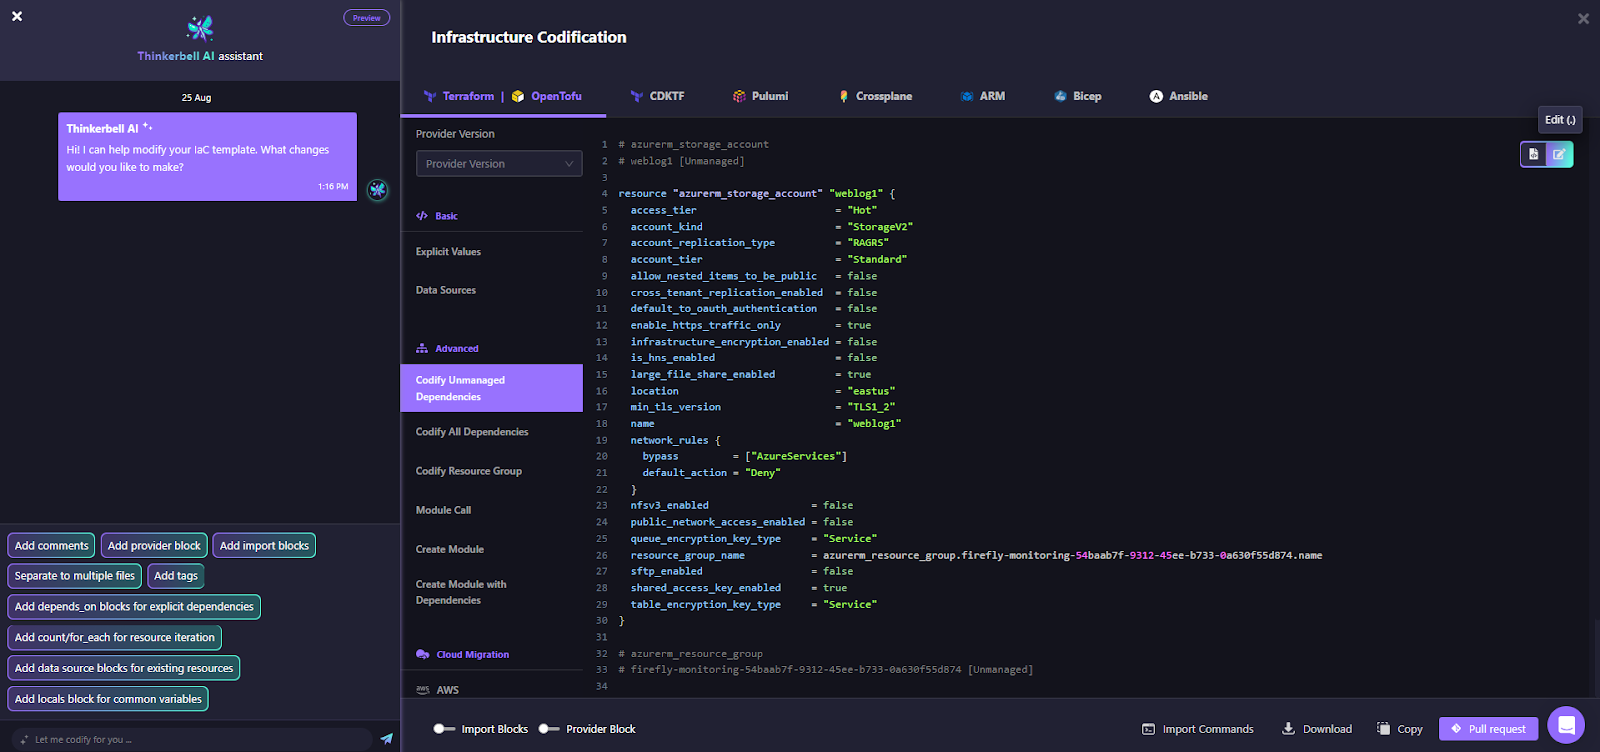
What used to require custom scripts is now visible, codifiable, and governable in one place.
Guardrails: Enforcing Policies, Costs, and Standards in IaC
Guardrails in Firefly act as automated checks for Infrastructure as Code (IaC) deployments. Instead of relying on after-the-fact security scans or manual policy reviews, Guardrails evaluate the terraform plan / tofu plan / terragrunt plan outputs before changes are applied. If a deployment violates organizational rules, Firefly can block it (strict enforcement) or pause and allow overrides (flexible enforcement).
This ensures that cost thresholds, security policies, resource restrictions, and tagging standards are applied consistently across all workspaces and repos.
Cost Guardrail
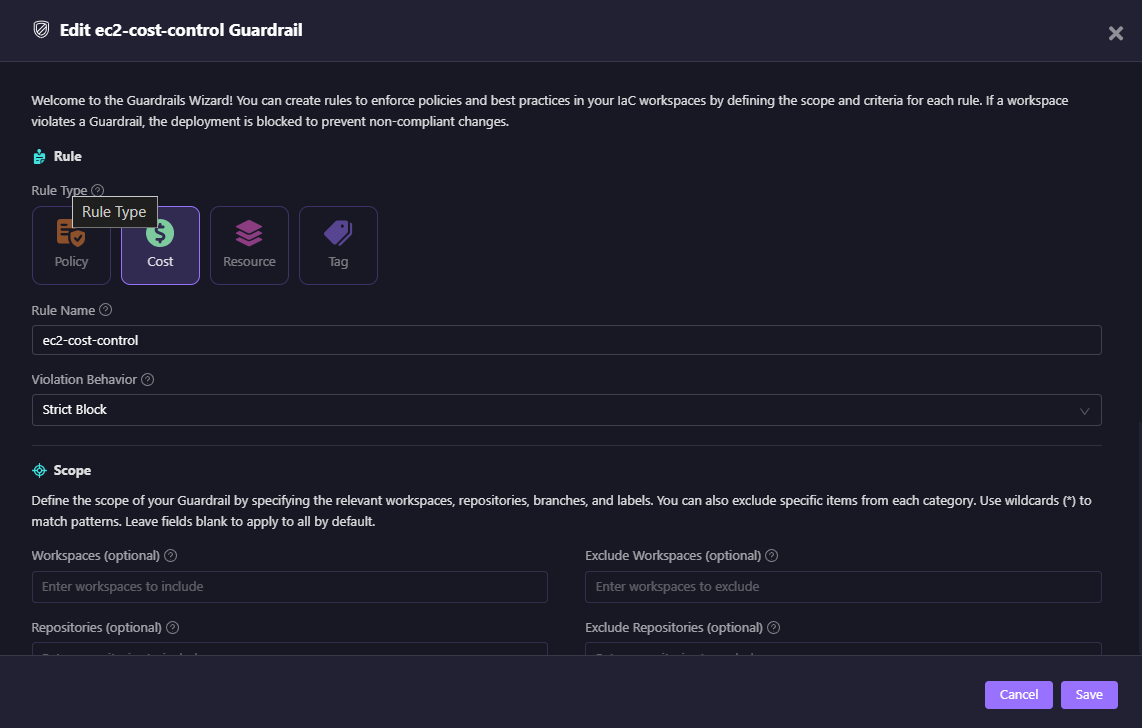
The snapshot above shows a Cost rule called ec2-cost-control.
- Rule Type: Cost
- Violation Behavior: Strict Block
- Scope: Can be narrowed down to specific workspaces/repos or left global.
This rule enforces that EC2 changes exceeding a cost threshold (set during rule definition) are blocked at plan time. Without this, teams typically rely on finance reports weeks later to catch anomalies.
Policy Guardrail (S3 Versioning)
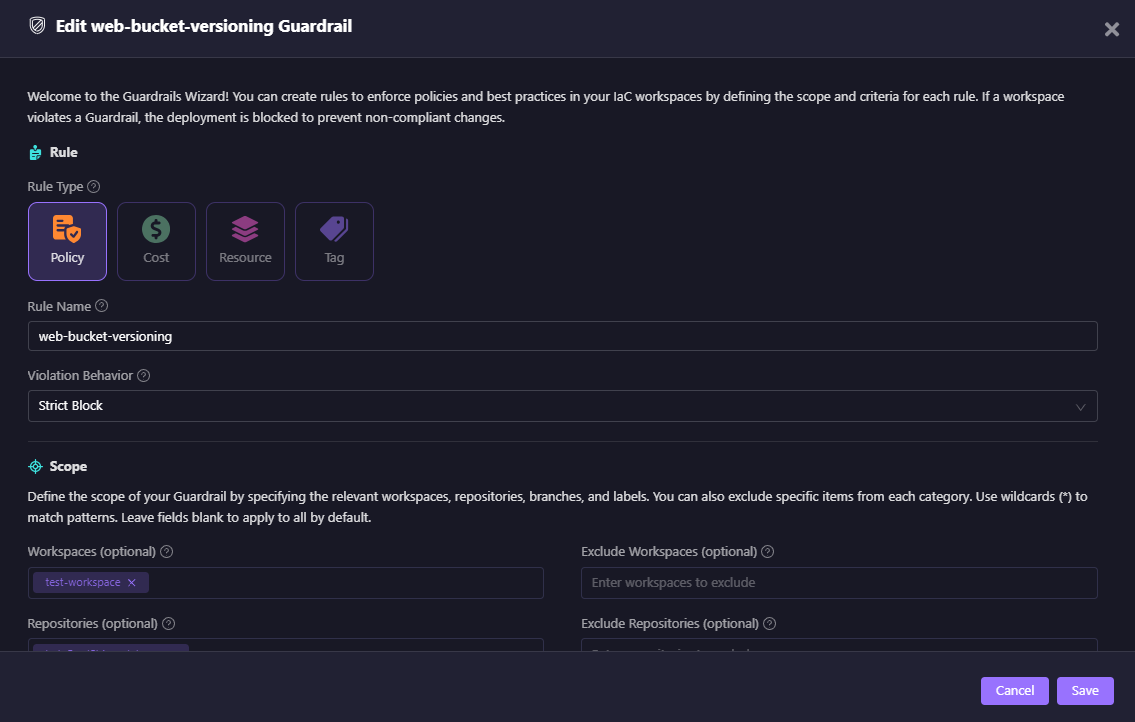
The above guardrails show a Policy rule named web-bucket-versioning:
- Ensures all S3 buckets created in the test workspace have versioning enabled.
- Uses Firefly’s integration with OPA (Open Policy Agent) to evaluate planned resources against compliance rules.
- Configured as a Strict Block, so IaC that violates the rule cannot be applied.
Guardrail Dashboard
The Guardrails dashboard, as in the snapshot below, provides a central view of all active rules, showing their type (Policy, Cost, Resource, or Tag), defined criteria, scope across repositories, workspaces, branches, or labels, and the configured violation behavior (Strict or Flexible Block).
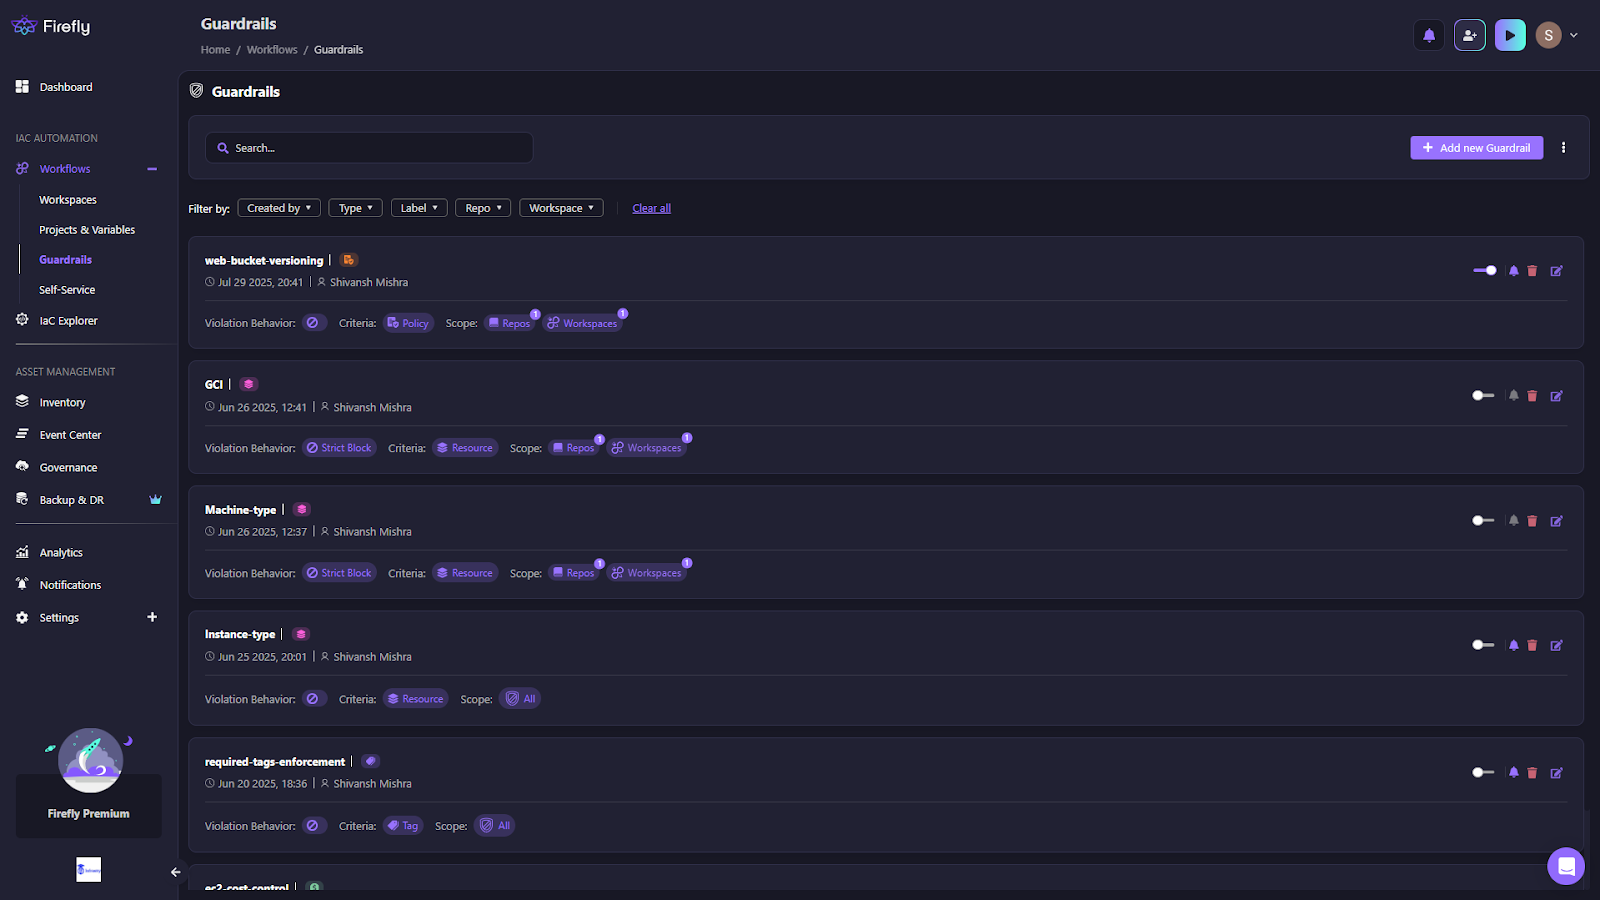
This gives engineers a clear picture of which rules apply to their IaC workspaces and whether enforcement is set to block deployments or only issue warnings.
Scaling Cloud Infrastructure Management With Projects
Managing cloud infrastructure at scale quickly becomes unmanageable if you rely only on naming conventions, spreadsheets, or scattered IAM patches. Teams need a way to separate environments, enforce boundaries, share variables, and manage access consistently. Firefly’s Projects feature provides that structure by acting as the primary organizational unit for workspaces, variables, and access controls.
Projects allow organizations to:
- Define clear boundaries for teams, apps, and environments.
- Centrally manage credentials and variables with inheritance rules.
- Apply consistent drift detection schedules and guardrails.
- Enforce access control through RBAC across the hierarchy.
This makes infrastructure operations structured, auditable, and scalable instead of ad hoc.
Defining a Project Boundary
When creating a project, you specify its name, labels, user assignments, and default drift schedule. Projects enforce the separation of concerns and become the anchor for all related workspaces and variable sets.
In the snapshot below, a project named web-logs-storage is being edited.

The project view shows the project’s name and description to define its scope, along with labels that categorize environments (such as dev or kris) for easier filtering and reporting. It also lists user assignments with defined roles and includes a default drift plan option, which enables automatic drift detection on a scheduled basis.
Centralizing Variables With Variable Sets
Instead of scattering credentials or re-declaring configs, Firefly lets you store them in Variable Sets. These can be scoped to a project and securely inherited by child workspaces.
In the snapshot below, a variable set called runner-variables is assigned to the web-logs-storage project.
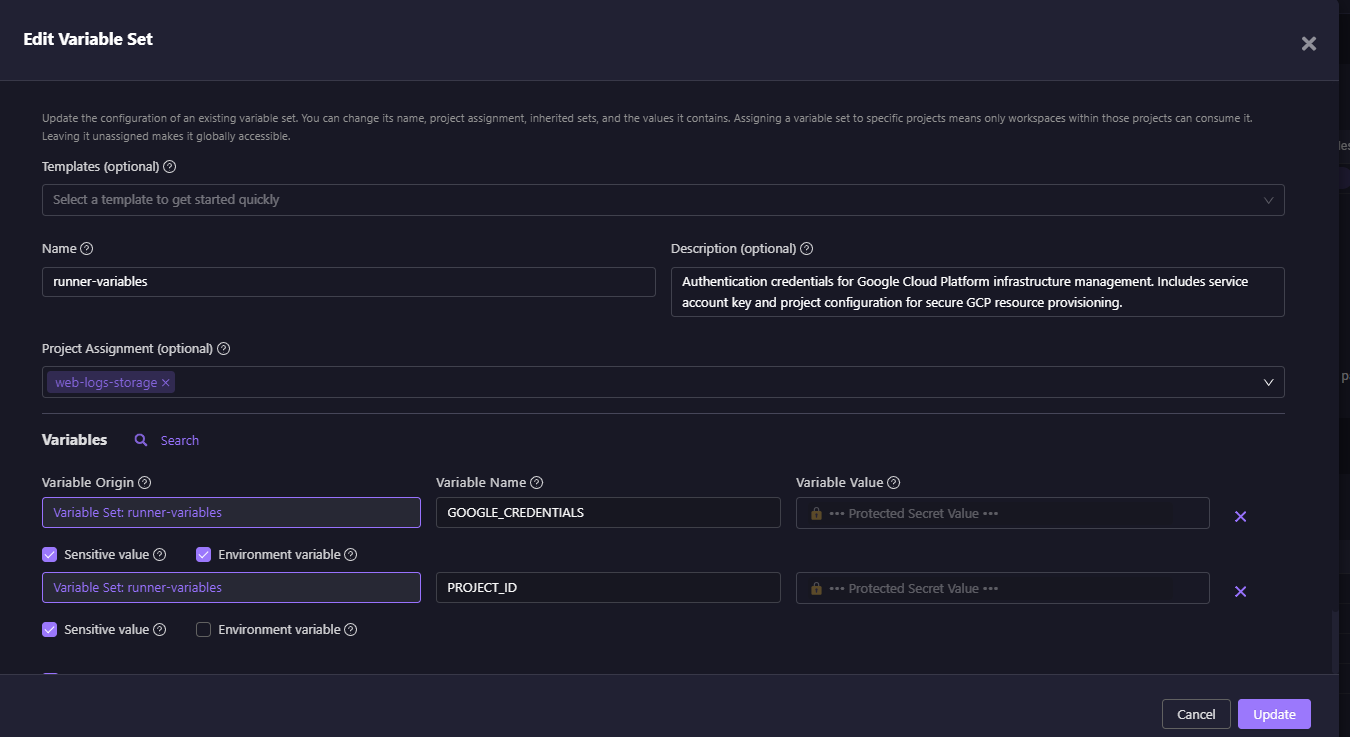
This view shows a project assignment scoped to the web-logs-storage project, with variable definitions such as GOOGLE_CREDENTIALS and PROJECT_ID. Sensitive values like credentials are securely masked to prevent exposure in logs, and environment flags allow selected variables to be exported into execution environments for use during runs.
Consuming Variables in Workspaces
Workspaces consume variable sets but can also override values, with full visibility into where each variable comes from. This ensures consistency while allowing flexibility at the edges.
In the snapshot below, a workspace is configured to pull variables from the runner-variables set.
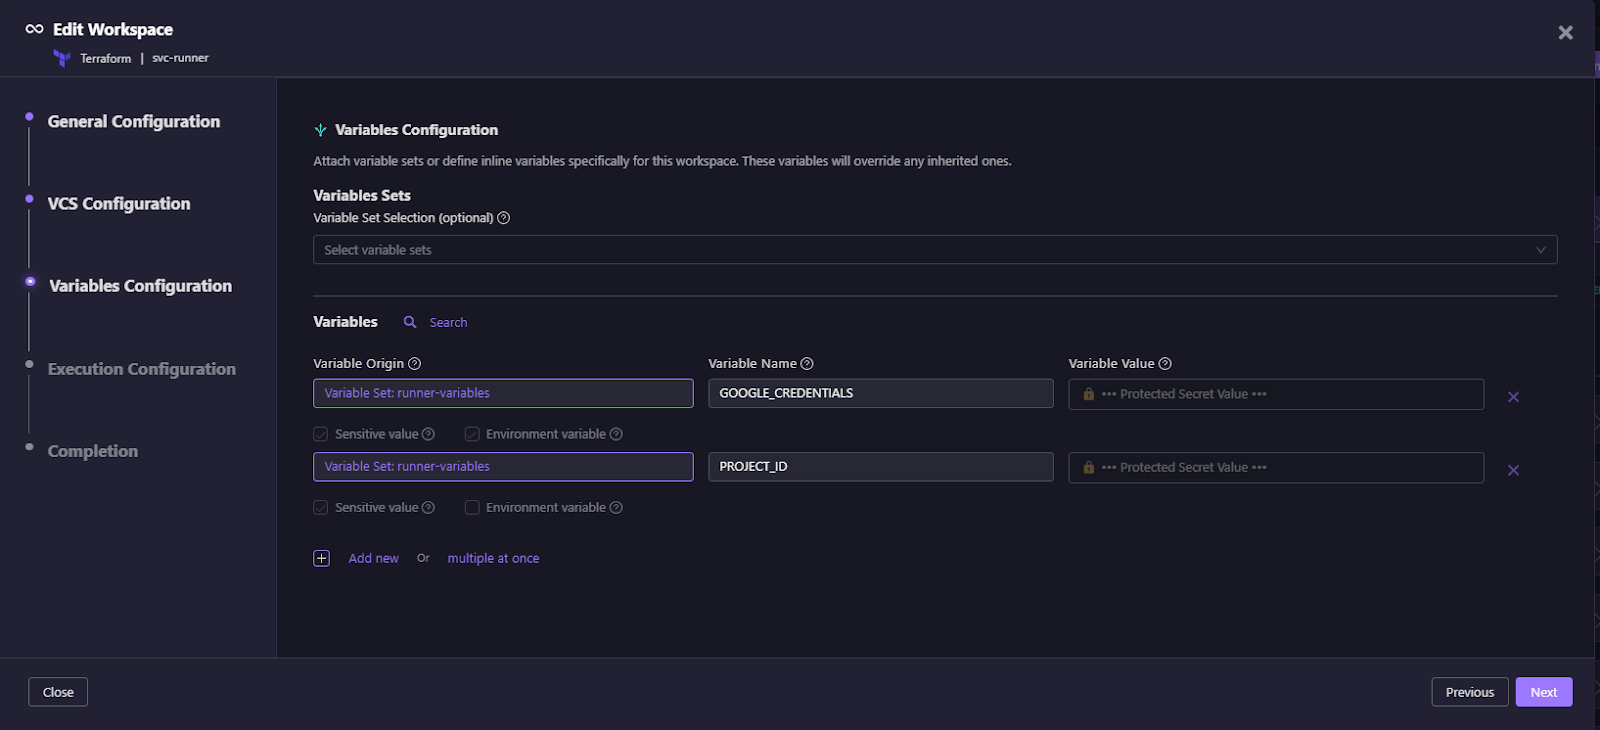
This view shows variable origin labels that trace each variable back to its source, while also allowing workspaces to add or override variables with clear, auditable precedence. Sensitive values are securely handled so that protected data is never exposed in plaintext.
Viewing Workspaces Under a Project
Once projects and variables are in place, all workspaces tied to that project are visible under the Workflows > Workspaces section. This gives a central view of runs, IaC versions, and their current status.
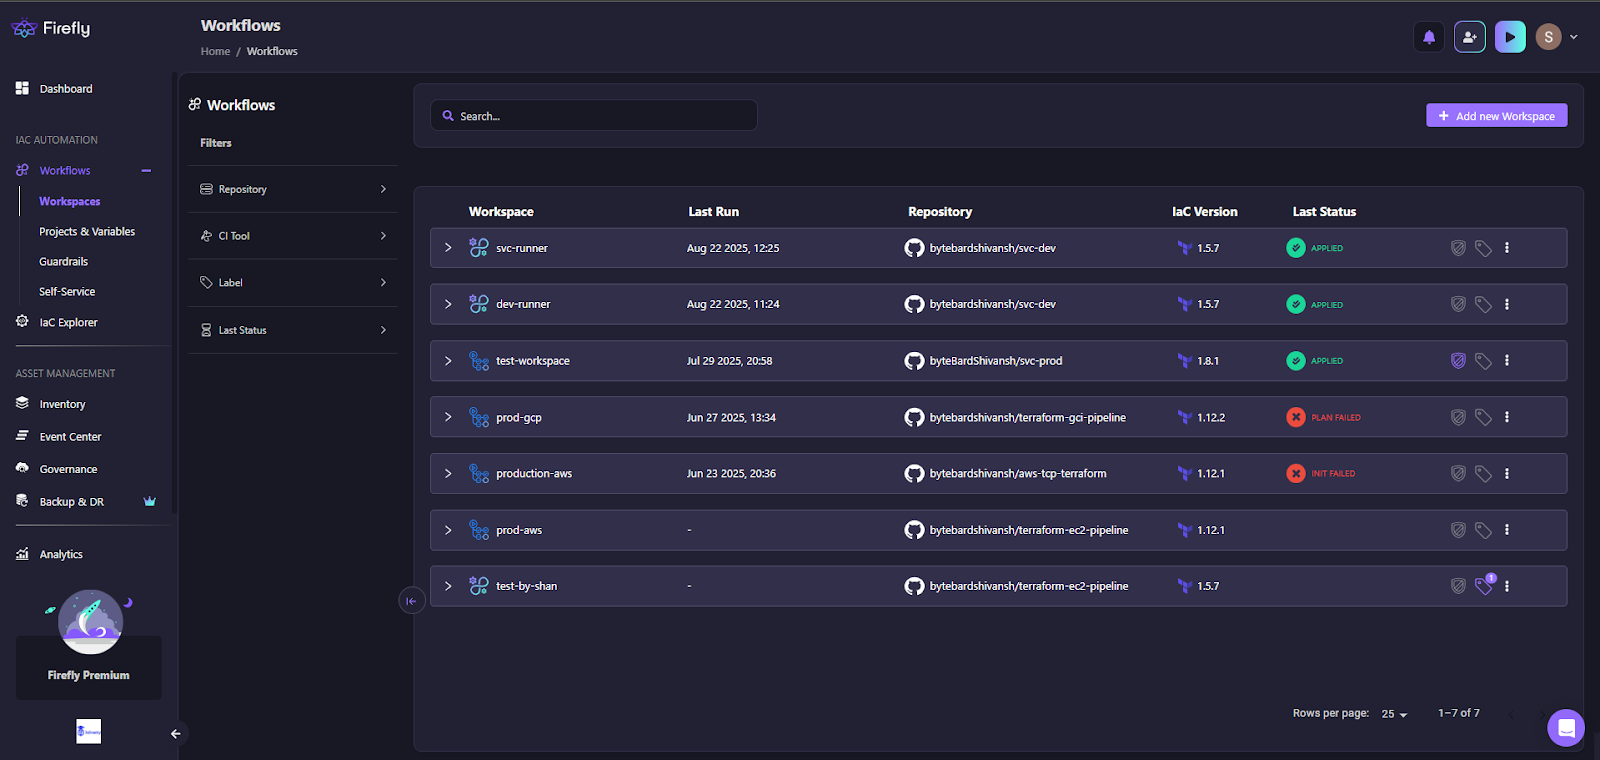
The workspace list view displays multiple workspaces connected to repositories and specific IaC versions, with clear status indicators showing whether the most recent plan or apply succeeded or failed. It also includes search and filter options, allowing engineers to quickly organize workspaces by repository, CI tool, or labels for easier navigation and management.
Deployment With Inherited Variables
When a workspace runs, variables from its assigned project and sets are automatically applied. Overrides are honored, and results are tracked through the execution pipeline.
In the snapshot below, a workspace run has successfully created resources using inherited credentials and project-scoped variables.
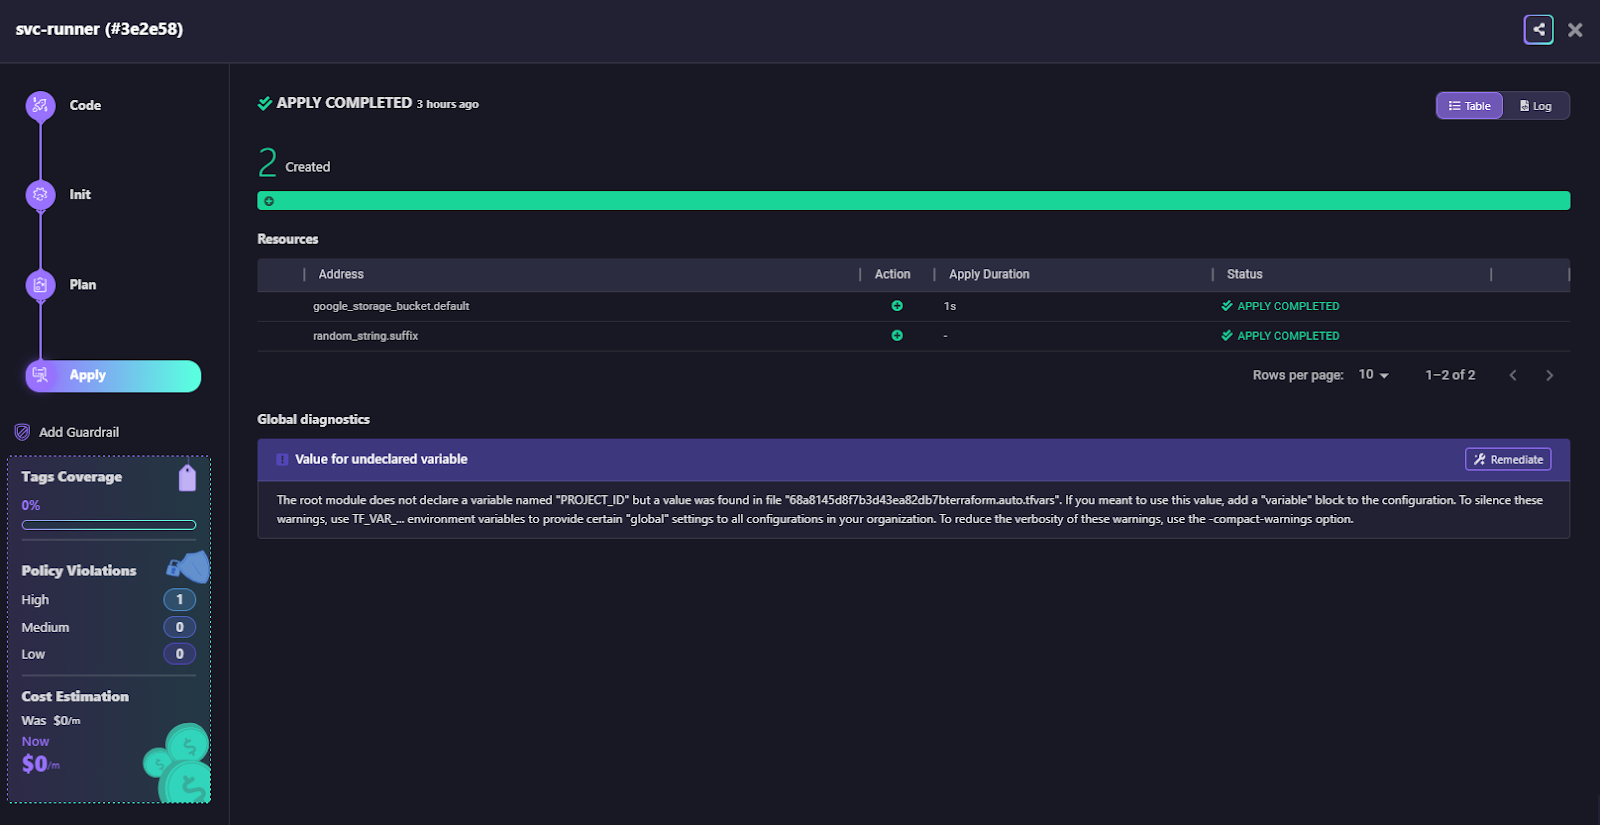
The run output view shows the full execution flow across stages, Code, Init, Plan, and Apply, along with details of the resources created, such as a GCP storage bucket. It also provides diagnostics by flagging issues like undeclared variables and suggesting remediation steps. In addition, it surfaces cost estimates and policy compliance status inline, giving engineers visibility into both financial and governance impacts during execution.
Replacing Scripts and Spreadsheets with Firefly
Firefly replaces a pile of scripts and scattered consoles with a single workflow: discover → codify → plan with cost/policy → apply with approvals → watch for drift. Projects give clean boundaries and RBAC, Variable Sets handle inheritance and secrets, Guardrails keep cost and compliance in the PR, and periodic plans hold runtime to the same standard. Multi-cloud management becomes repeatable, auditable, and cost-aware, without building and maintaining six tools yourself.
FAQs
What are the four components of cloud infrastructure?
The four core components are compute, storage, networking, and virtualization. Compute provides processing power, storage manages data, networking enables connectivity, and virtualization abstracts physical resources for flexible provisioning.
What are the three categories of infrastructure management?
Cloud infrastructure management is generally grouped into systems management, network management, and storage management. These cover compute resources, connectivity, and data handling to ensure availability, performance, and security.
What are the features of cloud infrastructure management?
Key features include automation, monitoring, security, cost optimization, and governance. With these, teams can provision resources on demand, track usage, maintain compliance, and keep infrastructure consistent across environments.
What are cloud management tools?
Cloud management tools help provision, monitor, secure, and optimize cloud resources. Examples include Terraform for IaC, Datadog for observability, Prisma Cloud for security, and Firefly for governance and cost guardrails.
What are the best cloud infrastructure tools?
The best cloud infrastructure stack combines provisioning, orchestration, and governance. Terraform and Pulumi are commonly used for provisioning, while AWS CloudFormation and CDK are popular in AWS-native environments. For cloud infrastructure automation and IaC orchestration, Firefly acts as an agentic control plane across AWS, Azure, GCP, Kubernetes, and SaaS, providing real-time asset inventory, automated IaC generation, drift detection, workflow automation, and policy enforcement to continuously reconcile code with cloud at scale.

.avif)
.avif)


.webp)


.webp)


