
By 2025, using Terraform for infrastructure, CI/CD pipelines for delivery, and Kubernetes for workloads is the baseline. Nobody is impressed by that anymore; if you’re not already there, you’re behind. But once that foundation is in place, the real challenge begins: keeping systems reliable, compliant, and cost-efficient without slowing engineers down. Regulators are tightening controls, CFOs are scrutinizing cloud spend line by line, and customers expect near-zero downtime as the default.
The 2024 DORA report makes this clear: the highest-performing teams aren’t just deploying faster, they’re more resilient. They achieve shorter lead times, lower change failure rates, and faster recovery by baking continuous improvement, measurement, and experimentation into their daily workflows. In other words, speed alone is no longer the metric; teams thrive when they can adapt quickly, recover cleanly, and scale practices without chaos.
That’s the bar for DevOps in 2025. This blog breaks down the practices that matter most at this stage, drawn from what we see working in production today, whether you’re a startup rolling out your first multi-region system or an enterprise running thousands of services.
The Modern DevOps Landscape in 2025
Before getting into what DevOps in 2025 looks like, it’s worth looking at the reality on the ground. The State of IaC 2025 report by Firefly makes it clear: almost 90% of organizations use IaC today, but fewer than 7% have fully codified infrastructure across cloud and SaaS.
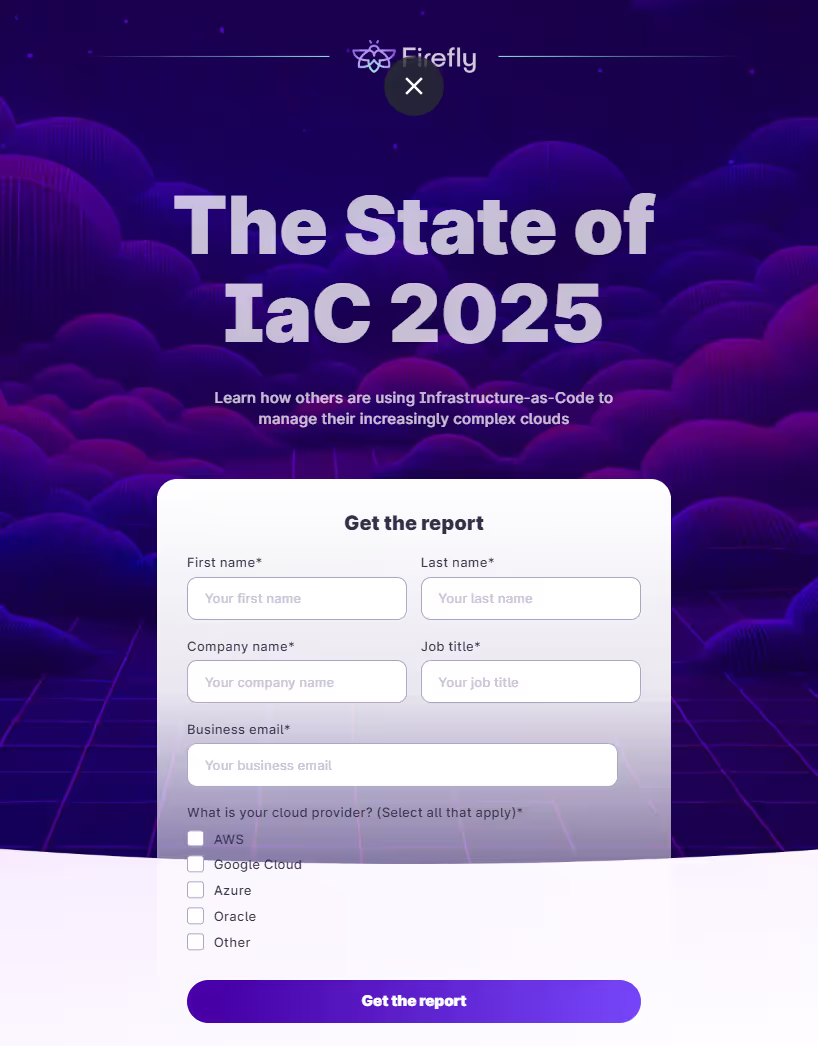
Most organisations sit at 40–60% coverage, still relying on manual drift detection and one-off policy reviews. That’s the gap between adoption and maturity.
Last year, “best practices” were about getting IaC, CI/CD pipelines, Kubernetes, and some level of DevSecOps in place. The 2024 benchmark also showed that the best-performing teams weren’t just adopting tools; they were excelling because of their ability to continuously improve. They tracked the right metrics, experimented, and iterated fast, treating challenges as learning opportunities instead of blockers.
The DevOps world in 2025 isn’t defined by whether you use IaC, CI/CD, or Kubernetes. Those are assumed. The real story is the new forces shaping how systems are built and run: automation powered by AI, compliance baked into pipelines, multi-cloud sprawl, and cost pressure that never lets up. These are the realities most teams are dealing with today:
AI-driven operations
AI is now integrated into the toolchain. Models help pick the right test suites for a PR, optimize rollout speed, and surface anomalies faster than manual alert rules. Large language models are being used for code reviews, writing runbooks, and even drafting Terraform modules. The value isn’t in flashy automation, it’s in shrinking the gap between issue detection and resolution.
Security and compliance as part of delivery
DevSecOps isn’t optional. Pipelines run SAST, dependency scans, and secrets checks on every commit. Admission controllers enforce encryption, signed images, and least-privilege network policies before workloads launch. Compliance reporting is generated continuously, not once a year. If a service handles PCI or HIPAA data, you can’t deploy until the full chain of checks is green.
APIs and AI as new attack surfaces
According to IBM’s 2025 breach report, APIs are now a major entry point for attackers, especially when tied to AI services or plugins. A misconfigured plugin or weak token can open the door wider than any Kubernetes misconfig. Shadow AI is another growing problem: unauthorized tools running inside orgs have made breaches $670k more expensive on average. Without governance and access control for AI, you’re basically leaving a side door unlocked.
Credential hygiene is still failing
The same IBM report showed stolen credentials still dominate breaches, with attackers sitting undetected for ~246 days on average. That’s eight months of quiet access. Teams that don’t have automated secret rotation, anomaly detection, and credential monitoring are taking unnecessary risks. In 2025, secrets scanning and rotation are basic hygiene.
Kubernetes and cloud-native dominance
Kubernetes is still the control plane for containers, but it’s not just about scheduling pods anymore. Service meshes handle retries and mTLS, autoscalers balance cost vs. performance, and serverless jobs run side by side with microservices. Most orgs aren’t single-cloud; AWS plus GCP or Azure is common, so GitOps patterns have become the only way to keep deployments consistent across environments.
Platform engineering to scale DevOps
Internal developer platforms (IDPs) are the only way to scale practices across dozens or hundreds of teams. A single “create service” flow can spin up a repo, CI pipeline, GitOps app, monitoring, and policy hooks in minutes. Developers don’t touch Terraform or Helm directly; they ship through paved paths that are secure and production-ready by default.
Event-driven automation and GitOps
Git has become the control plane. Every infra or app change goes through PRs, with pipelines enforcing security checks, cost checks, and progressive rollout rules. Deployments are event-driven; new commits or artifact pushes trigger workflows in real time, not on schedules. Rollouts halt automatically when SLOs degrade, and rollback happens without waiting for human approval.
Unified observability
Logs, metrics, and traces are no longer split across tools. Teams lean on unified stacks, Prometheus, Grafana, and OpenTelemetry to correlate signals end-to-end. Dashboards overlay deploy markers so you can trace a latency spike straight to a PR. Tail-based sampling keeps only the critical traces: errors and slow paths. Observability is about cause, not just symptoms.
FinOps inside the pipeline
Cloud cost is treated the same way as a failing test. If a PR changes autoscaling limits and adds $1,200 a month, the pipeline flags it before merge. Idle volumes and orphaned IPs are swept nightly. Engineers see cost impact in the same dashboards as performance metrics. Finance no longer chases engineering; DevOps owns the spend directly.
Value stream visibility
It’s not just metrics on infra anymore. Value Stream Management tools track the flow from commit to production, showing where changes stall or pile up. This provides concrete data on bottlenecks, including whether builds are slow, approvals are stuck, or deployments are too manual.
Continuous upskilling
The stack evolves too fast to coast. Engineers are expected to stay current in Kubernetes, cloud-native stacks, security, and now AI/ML. Certs like CKA or AWS DevOps Engineer aren’t résumé padding; they’re a baseline for production responsibility. Teams that don’t invest in this find themselves firefighting avoidable problems.
The bar is higher now. Shipping fast isn’t enough; you need to ship with guardrails, visibility across the stack, and costs under control. The teams that thrive are the ones that treat these practices as non-negotiable, not as “future goals.”
Best Practices for Production-Level & Enterprise DevOps in 2025
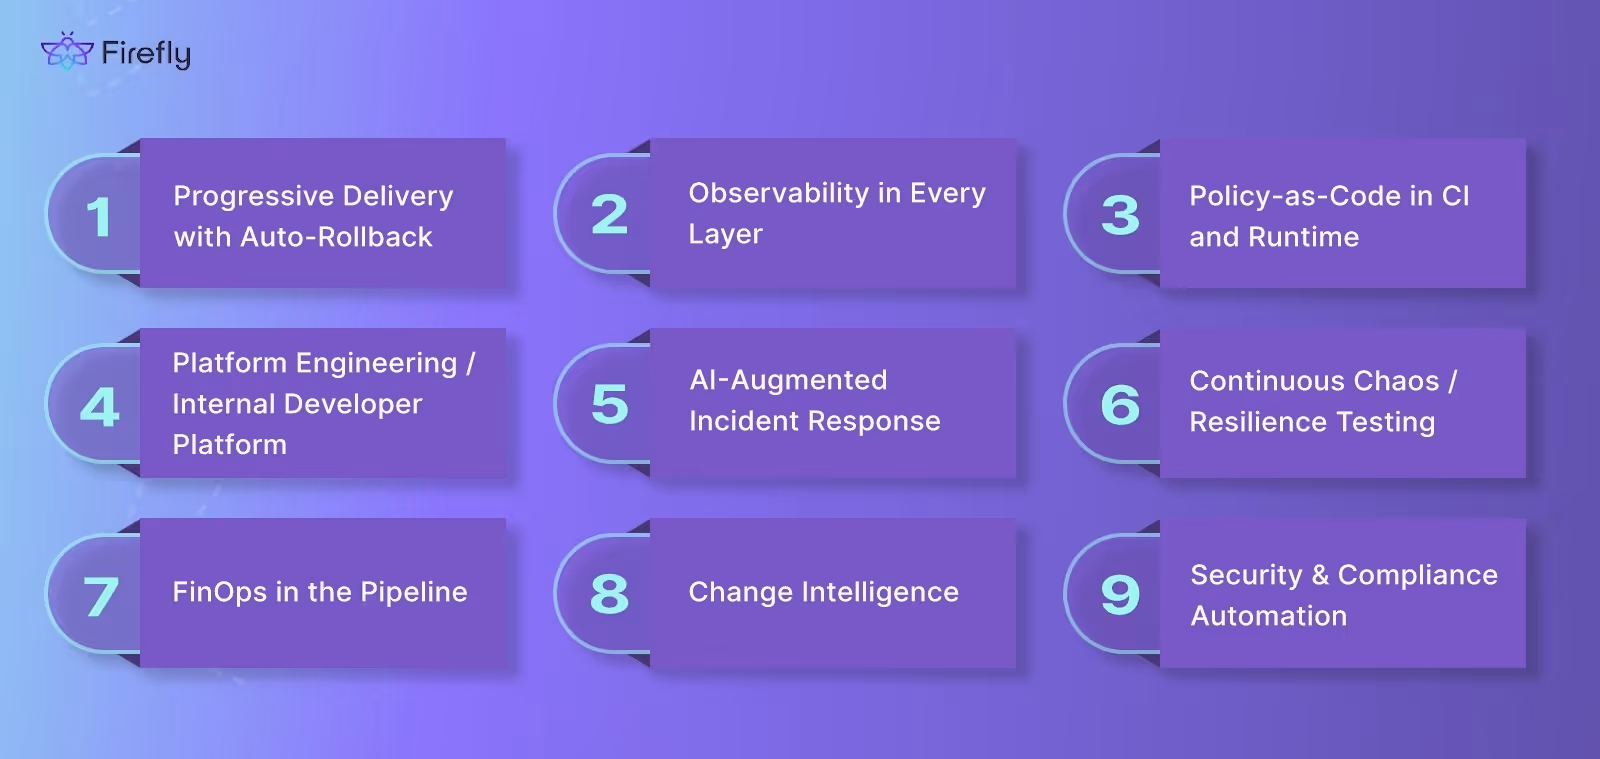
1. Progressive Delivery with Auto-Rollback
Traditional Kubernetes rolling updates give you little control; pods are replaced incrementally, but there’s no built-in rollback based on metrics. That’s fine for dev, but not for production, where a bad release can burn customer trust or breach SLAs within minutes.
Progressive delivery fixes this by combining deployment strategies like blue/green and canary with automated KPI checks. Instead of relying on manual sign-offs, the rollout moves forward or rolls back automatically based on telemetry.
On Amazon EKS, this is typically done with Argo Rollouts plus Amazon Managed Service for Prometheus:
- Blue/green with analysis stages: Argo spins up a “green” version alongside the stable “blue” one. A preview service lets you run smoke or integration tests before exposing users. Argo queries KPIs (e.g., error rate, latency, throughput) from Prometheus in a prePromotionAnalysis phase. If they meet thresholds, traffic flips to green. After promotion, a post-promotion analysis validates KPIs in production. If KPIs degrade, Argo reverts automatically.
- Canary with traffic shaping: Instead of an all-or-nothing cutover, Argo gradually shifts live traffic, 1%, 5%, 25%, etc.,to the new version. Traffic routing is controlled through an Application Load Balancer or service mesh. At each step, PromQL queries run in the background. If p99 latency spikes above the threshold or the error rate exceeds the budget, the rollout halts and routes traffic back to the stable release.
This model removes manual bottlenecks. No waiting for a QA team to validate green. No ops engineer flipping DNS. No late-night pager call to decide whether to roll back. The system enforces guardrails automatically, based on metrics you define. The benefit is predictable: you get faster, safer deploys, fewer customer-impacting incidents, and a cleaner audit trail, because every rollout, analysis, and rollback is logged in Git and Prometheus.
2. Observability in Every Layer
In 2025, observability isn’t a luxury add-on; it’s wired into the pipeline the same way CI/CD is. Without it, you’re blind when production goes sideways. Mature teams don’t settle for logs alone; they collect metrics, logs, and traces with shared identifiers so issues can be traced from a customer request all the way back to the commit that introduced it.
The practical setup looks like this:
- OpenTelemetry everywhere: Every service exports telemetry with a trace_id and service.version (the Git SHA) attached. That ID flows through logs, traces, and metrics, so you can stitch the story together without guesswork.
- Deploy markers on dashboards: Each deployment automatically annotates Grafana or Datadog dashboards with the commit, PR number, and owner. When p95 latency jumps, you can click directly from the graph to the PR that caused it.
- Tail-based trace sampling: Instead of keeping every trace, you keep only the interesting ones, errors, high latency, and outliers. This keeps storage costs sane while preserving the signal you need for debugging.
- Unified stack: Teams run consolidated observability stacks like Grafana Mimir (metrics) + Loki (logs) + Tempo (traces), often tied directly to CI/CD. That removes the need to swivel between tools and gives one view across the whole system.
Example: an e-commerce checkout service starts failing intermittently. With trace IDs carried through, you see that every failing request maps to deploy abc123 (PR #742). The dashboard shows a spike in DB query latency right after that deploy. One click later, you’re at the commit diff that introduced the slow query. Rollback is automatic, and you already know where to fix.
Observability at this level isn’t about pretty dashboards, it’s about shortening the path from alert → root cause → rollback → fix. Without it, you’re guessing; with it, your incident response time drops from hours to minutes.
3. Policy-as-Code in CI and Runtime
By 2025, policy-as-code isn’t just “best practice” , it’s required if you want to keep pace with dozens of deploys an hour across multiple clouds. The old model of security reviews, wiki checklists, or “ask the platform team” doesn’t work anymore. Policies have to be codified, versioned, and enforced automatically at both CI and runtime.
Here’s how that looks in practice:
- CI enforcement
Every pull request runs against a central policy repo. Tools like OPA, Kyverno, or Checkov validate Terraform and Kubernetes manifests before merge. Example rules:- Block a PR that adds a 0.0.0.0/0 ingress rule.
- Fail builds if EBS volumes are unencrypted.
- Reject containers that aren’t signed.
- Runtime enforcement
The same policies run live in the cluster via admission controllers. Even if something sneaks past CI, it doesn’t get scheduled if it’s non-compliant. The runtime guardrails mirror CI checks, so there’s no drift between environments. - CloudFormation Guard hooks
AWS has tightened this up by baking Guard directly into CloudFormation Hooks. Instead of running Guard checks as custom scripts, you can now attach a managed Guard hook to stacks and resources.- Example: a stack-level Guard hook prevents any stack from creating unencrypted S3 buckets.
- Example: a resource-level hook enforces that every bucket provisioned via CloudFormation has versioning enabled and BlockPublicAcls = true.
These rules are written in Guard DSL, stored in S3, and executed automatically at provisioning time. If they fail, the stack creation itself fails. No human review, no exceptions slipping through.
- Example: a stack-level Guard hook prevents any stack from creating unencrypted S3 buckets.
- Centralized governance
Enterprises keep one repo of policies (OPA rego, Guard rules, Kyverno manifests) that sync across all clusters and accounts. When a compliance team tightens a rule, e.g., disallowing untagged resources for FinOps tracking, it applies everywhere within minutes.
The benefit is twofold: engineers get immediate feedback in PRs, and auditors get confidence that every deploy, across stacks and clusters, is continuously checked. Policy isn’t a spreadsheet anymore; it’s code that blocks bad changes before they ever hit production.
4. Platform Engineering / Internal Developer Platform
As systems have grown more complex, handing developers raw Terraform modules, Helm charts, or AWS console access has become a recipe for drift and outages. By 2025, most mature orgs will solve this with platform engineering, building an Internal Developer Platform (IDP) that gives developers paved paths instead of a pile of tools.
Here’s how it works in practice:
- Self-service service creation: A developer clicks “Create Service” in a portal (often powered by Backstage or a custom frontend). Behind the scenes, the platform provisions a Git repo, CI pipeline, ArgoCD app, monitoring dashboards, alert rules, and policy hooks. Ten minutes later, they’ve got a production-ready service scaffold, not a blank repo.
- Golden templates: Everything is standardized: base Dockerfiles, Helm charts, Terraform modules, and IAM roles. Developers don’t have to debate which logging library or which ingress pattern to use; it’s baked into the template. This cuts cognitive load and ensures every new service follows org standards from day one.
- Integrated guardrails: Policies and cost controls are included in the path. For example, every service created through the portal comes with tagging for FinOps, OPA policies for security groups, and monitoring hooks wired into Grafana/Prometheus. Compliance isn’t something devs add later; it’s there by default.
- Multi-cloud abstraction: With workloads spread across AWS, GCP, and Azure, the IDP abstracts provider details. Developers request “a database” or “a message queue,” and the platform provisions it using the right cloud provider module. This avoids the sprawl of one-off IaC scripts per team.
Example: at Spotify, Backstage templates generate new microservices with CI/CD, Kubernetes manifests, monitoring, and SLOs already in place. At other enterprises, the same approach is used to create data pipelines, serverless jobs, or even entire environments with a single request.
The impact is clear: developers focus on building features, not gluing YAML and IAM policies together. Ops teams stop firefighting inconsistent setups and instead evolve the platform itself. Reliability improves because every service runs on the same hardened baseline.
5. AI-Augmented Incident Response
Incidents haven’t gone away in 2025, but the way we handle them is different. The key shift is tighter integration between monitoring, alerting, version control, and ITSM platforms, so context is already stitched together when the on-call gets paged.
- Monitoring + Alerting: When Datadog or New Relic detects an anomaly, say a sudden error spike or latency jump, alerts are automatically enriched with recent changes. Instead of just “checkout service 500s,” the alert includes the last deploy, the infra diff, and the resource owner. PagerDuty or OpsGenie then routes it straight to the right team.
- Version Control Traceability: Incidents are no longer isolated from code. Alerts link directly back to the commit or PR that introduced the change. If a Terraform plan modified an ALB target group, that diff is visible in the incident context without digging through Git history.
- Identity & Access Context: Access-related incidents are tied to who made the change and when. Integrations with identity systems like Okta or Secret Managers mean that an IAM policy drift or expired credential shows up in the incident record immediately.
- Ticketing and Collaboration: Jira or ServiceNow tickets are auto-created with the telemetry, config diff, and ownership metadata already attached. Chat integrations (Slack, Teams) surface the incident with one-click remediation steps, like rolling back to the previous deployment or restoring IaC-defined config.
- Automated Remediation: Common fixes, restarting a pod, reverting a drifted resource, and disabling a misconfigured rule can be executed directly from the incident workflow. For higher-risk changes, the system posts a safe remediation proposal for human approval.
Example: Datadog reports 500 errors on checkout. The PagerDuty alert shows it coincides with deploy #742, which updated the ALB listener config. The on-call opens the incident in Slack, sees the infra diff, and reverts to the last known good config with a single click. Jira automatically records the incident timeline and resolution.
With Firefly integrations across monitoring (Datadog, New Relic), alerting (PagerDuty, OpsGenie), version control (GitHub, GitLab), and ITSM (Jira, ServiceNow), these workflows become seamless. The incident lifecycle, detection, triage, and remediation is automated end to end, while engineers stay focused on root cause analysis and long-term fixes.
6. Continuous Chaos / Resilience Testing
By 2025, chaos engineering isn’t a “game day experiment” anymore; it’s wired into delivery pipelines and scheduled into production under controlled conditions. The point is simple: you don’t want to discover resilience gaps for the first time during an outage.
Here’s how teams are running it today:
- PR-level chaos in staging: Every merge to main can trigger fault injections in staging. Tools like Chaos Mesh or Litmus introduce latency, kill pods, or throttle dependencies. Canary analysis only passes if the system’s fail-safes, circuit breakers, retries, and fallbacks handle the fault gracefully.
- Controlled chaos in production: In production, experiments run with a strict blast radius: one AZ, one region, or a subset of pods. Examples:
- Inject 300 ms latency on DB queries during off-peak hours.
- Kill a single Kafka broker and confirm consumer groups rebalance within SLA.
- Blackhole outbound DNS for 5 minutes and check if caching mitigates the failure.
These aren’t free-for-alls; they’re automated tests with rollback conditions and pre-approved safety nets.
- Inject 300 ms latency on DB queries during off-peak hours.
- Resilience as a deploy gate: Chaos results feed back into deployment pipelines. If the checkout service can’t withstand a simulated DB slowdown, it doesn’t promote past canary. This makes resilience validation a hard requirement, not an afterthought.
- Automation and observability tie-in: The experiments are hooked into observability stacks. Prometheus and Grafana record the impact, and alerts confirm whether SLOs stayed within budget. Teams use the data to refine retry logic, scaling rules, or failover configs.
Example: before promoting a new release, a chaos test injects latency into the payments DB. The system is expected to trigger a circuit breaker and route to a fallback. If instead it cascades errors to the checkout service, the deployment halts automatically. The bug is fixed before the release ever reaches 100% traffic.
The value isn’t in “breaking things for fun” , it’s in catching resilience failures in a controlled environment so customers never see them.
7. FinOps in the Pipeline
By 2025, cloud cost management will not be handled at the end of the month by finance; it’s enforced directly in the CI/CD pipeline. Engineers see cost impact alongside test results, and budgets act as deployment guardrails.
Here’s what that looks like in practice:
- Pre-merge cost checks: Every infra change runs through a cost estimation step. Tools like Infracost or native cloud billing APIs calculate projected spend. If a PR adds $1,200/month by changing autoscaling rules or provisioning larger instances, the pipeline flags it before merge. Some orgs enforce hard budgets, and mergers fail until a cost exception is approved.
- Nightly sweeps and auto-cleanup: Jobs run daily to find idle volumes, orphaned IPs, unused snapshots, or zombie clusters. In many setups, non-critical resources are terminated automatically, with a Slack notification for traceability.
- Service-level ownership of spend: Costs aren’t shown as one giant bill. Dashboards break down spend by service, team, or environment via mandatory tagging. If checkout services overshoot budget by 20%, the owning team sees it immediately in their Grafana or Datadog dashboards.
- Shift-left accountability: Cost is treated as a first-class metric, like latency or error rate. Deployment pipelines can block a rollout if the estimated cost exceeds defined thresholds, just as they would for a failing load test.
Example: a team submits a PR to bump RDS instances from db.m5.large to db.m5.2xlarge. CI runs Infracost, calculates an extra $1,800/month, and fails the job with a message: “Projected cost exceeds budget cap by $600. Approval required.” The team adjusts capacity, re-runs the pipeline, and merges only after the numbers align.
The result: finance and engineering are no longer at odds over cloud spend. Cost control happens automatically, as part of the same pipeline that enforces tests, policies, and security.
8. Change Intelligence
In complex systems, the hardest part of incident response isn’t detecting the problem; it’s figuring out what changed. By 2025, mature teams treat change events as first-class telemetry so every alert can be traced directly to the deploy, PR, or infra modification that caused it.
Here’s how it’s done:
- Deploy markers in observability: Every deploy logs metadata into monitoring systems, commit hash, PR number, ticket ID, and service owner. Dashboards overlay these markers on graphs. When p95 latency spikes, you immediately see “Deploy abc123 (PR #742 by Jane)” on the chart.
- Alert enrichment with change data: Alerts aren’t just “latency breach on checkout.” They include the last change event tied to that service. Example: “p95 latency ↑ 45% on checkout since deploying abc123 (PR #742).” On-call can click directly to the diff instead of hunting across tools.
- Infra drift visibility: It’s not just app deploys. Infra drift (like a manually changed security group or DNS entry) is logged as a change event. Incidents triggered by infra misconfigurations point straight back to the drift record.
- Audit trail for root cause: All changes, code, infrastructure, policies, and workflows flow into a central timeline. Postmortems don’t start with “what changed?” because the answer is already captured.
Example: an alert fires for elevated 500s in checkout. Grafana shows the spike started 3 minutes after deploy abc123. The alert payload links to the PR, which replaced a Redis client library. On-call rolls back with one click, restoring stability. The incident record already contains the change metadata, making the postmortem trivial.
Change intelligence doesn’t stop outages, but it makes connecting cause and effect immediate, turning what used to be an hours-long root cause hunt into a five-minute rollback.
9. Security & Compliance Automation
By 2025, security checks aren’t “extra steps” bolted onto release cycles; they’re fully automated inside CI/CD and runtime. Compliance isn’t a quarterly audit; it’s a set of guardrails that run on every build and deployment.
Here’s how mature setups handle it:
- CI pipeline security scans
- SAST (static analysis) checks application code for vulnerabilities before merging.
- SCA (software composition analysis) scans dependencies for CVEs.
- Secrets scanning blocks commits with embedded credentials.
- IaC scans (e.g., with Checkov or tfsec) check Terraform/Kubernetes manifests for risky configs before apply.
- SAST (static analysis) checks application code for vulnerabilities before merging.
- Admission controls in runtime: Kubernetes admission webhooks enforce compliance rules live. Examples:
- Reject unsigned container images.
- Block workloads that don’t use encrypted volumes.
- Require specific network policies for PCI- or HIPAA-scoped services.
- Reject unsigned container images.
- Artifact provenance: Images and IaC bundles are signed at build time. SBOMs (software bills of materials) are generated automatically and stored alongside artifacts, so auditors can trace exactly what went to production.
- Automated audit trail: Every build, test result, and deployment is logged with attestations. If a compliance check fails, the deploy is blocked. If it passes, the evidence is archived automatically. Auditors no longer chase screenshots; they review verifiable logs.
Example: A team tries to deploy a payment service. CI runs SAST, SCA, and IaC scans. Everything passes except SCA, which flags an outdated openssl package with a critical CVE. The pipeline blocks the deployment until the dependency is updated. Later, when the build succeeds, the container image is signed, the SBOM is attached, and the attestation is logged. At runtime, Kubernetes admission controllers verify the image signature before scheduling.
The result is continuous compliance: every change is vetted automatically, and production environments stay in line with regulatory and security requirements without slowing down delivery.
How Firefly Helps Put These Practices into Action
For most teams, best practices like policy enforcement, drift detection, cost checks, and compliance reporting don’t happen automatically. A senior DevOps engineer typically dedicates 30–40% of their week to tasks such as wiring IaC checks, maintaining OPA rules, tracking drifted resources, writing custom scripts for cost guardrails, and generating compliance evidence for auditors. That’s time not spent improving pipelines or building developer platforms.
With Firefly, most of that work is folded into the platform:
- Policy enforcement happens automatically at deploy and runtime, so you’re not manually writing and maintaining OPA bundles.
- Cost checks are built into the pipeline; you don’t need to wire an external tool.
- Drift detection is continuous.
- Compliance reporting is generated in real time, so instead of a week of audit prep, you’ve got exportable evidence anytime.
In practice, this shifts a DevOps engineer’s time investment from hours per day on manual guardrails and compliance glue to minutes per week reviewing alerts or tuning policies. Firefly’s role is to act as the control plane that unifies these practices without the glue code.
Here’s how it maps to what we’ve covered:
Progressive Delivery & Policy-as-Code:
Firefly enforces guardrails during and post-deployments. Unsafe changes, public S3 buckets, over-permissive IAM, or drifted Kubernetes objects, are blocked in CI or flagged live in runtime.
Deployment-time enforcement
During deployments, Firefly can enforce strict blocking for high-severity issues or allow soft alerts for lower-severity ones, giving teams flexibility without losing compliance coverage. This is important for progressive delivery (e.g., blue/green or canary rollouts), where policies must be validated continuously as traffic shifts to new versions.
The Guardrails Wizard lets you define scope and enforcement criteria at a granular level, by repository, branch, workspace, or label.
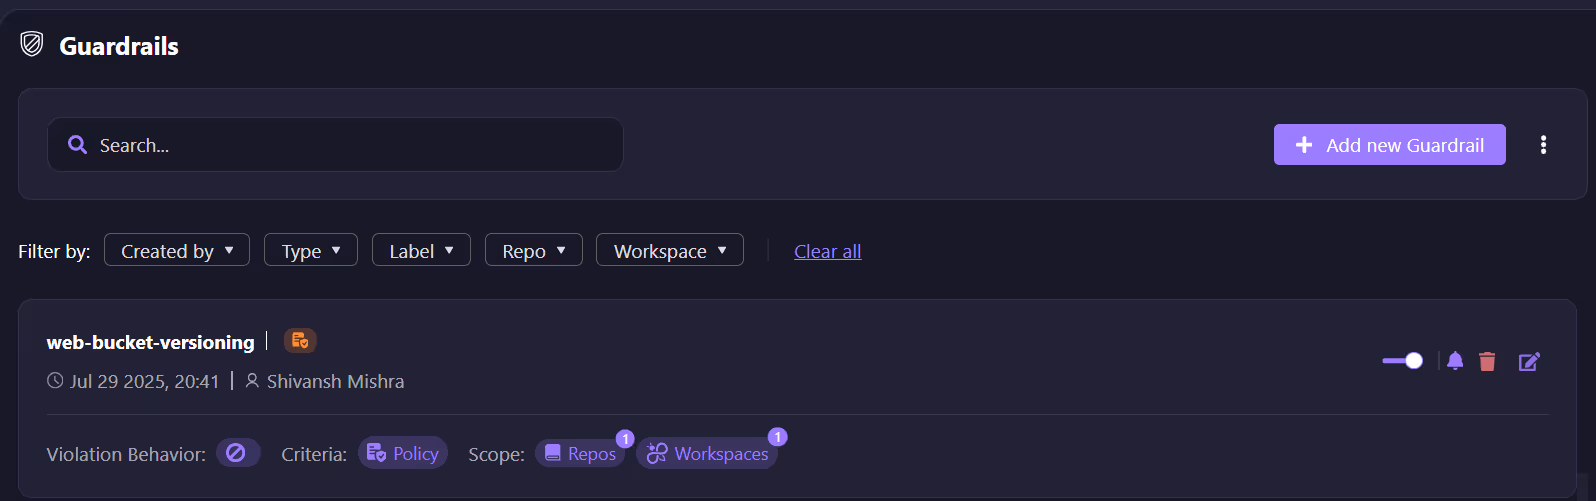
For example, in the screenshot above, a web-bucket-versioning guardrail enforces that all S3 buckets in a target workspace have versioning enabled. If this condition is not met, the deployment is blocked before any non-compliant resource hits production.
As shown below, the guardrail wizard provides a way to configure the violation behavior (e.g., Strict Block), attach the guardrail to specific repos or workspaces, and fine-tune inclusion/exclusion rules:
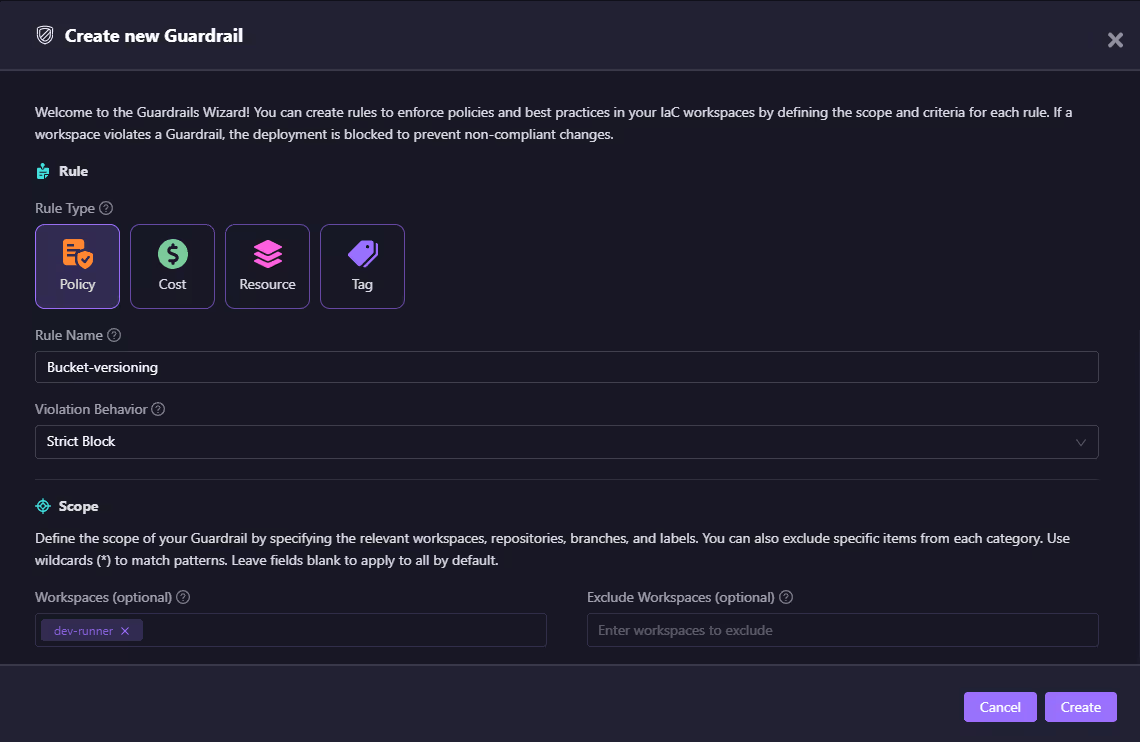
This ensures that policies are enforced consistently but without unnecessary noise across environments. With this setup, DevOps teams don’t need to manually validate IaC or runtime configurations. Firefly enforces policy-as-code continuously, so compliance and operational safety become a natural part of the delivery flow instead of an afterthought.
Post-deployment governance
Once resources are live, policies don’t stop at deployment; they continue running as continuous compliance checks. As shown below, Firefly’s Governance dashboard lists all active policies, their severity, violating assets, and compliance posture:
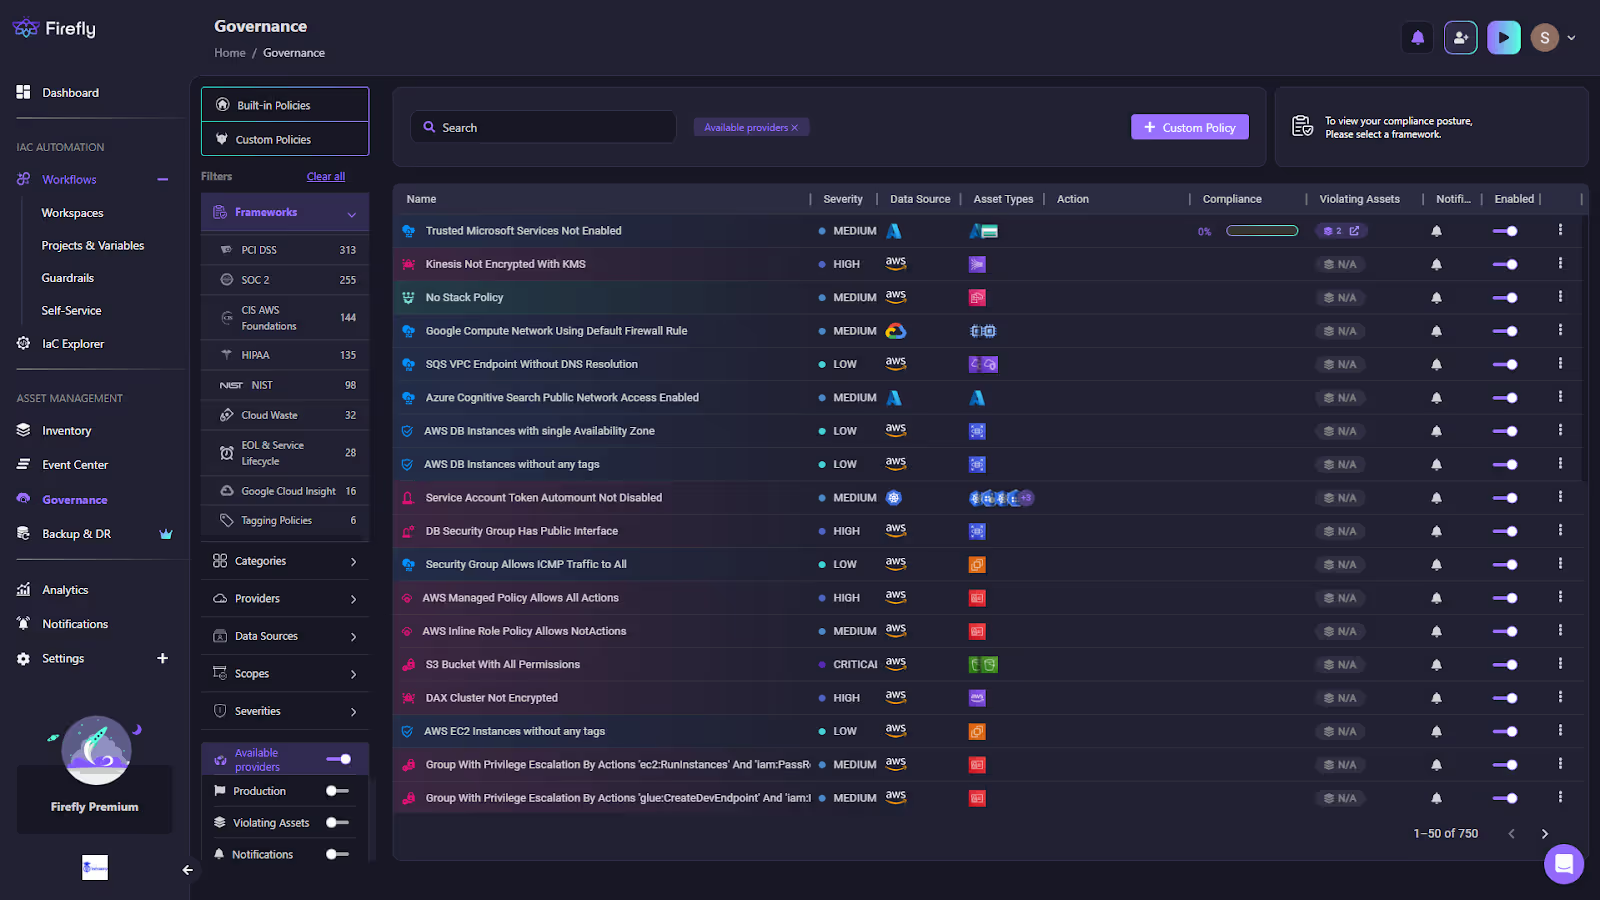
This gives teams visibility into runtime drift or unmanaged resources that wouldn’t be caught by IaC pipelines alone. If your organization requires custom controls (e.g., “all DB security groups must block public access” or “all S3 buckets must enforce encryption”), you can define them directly in the Custom Policy Builder:
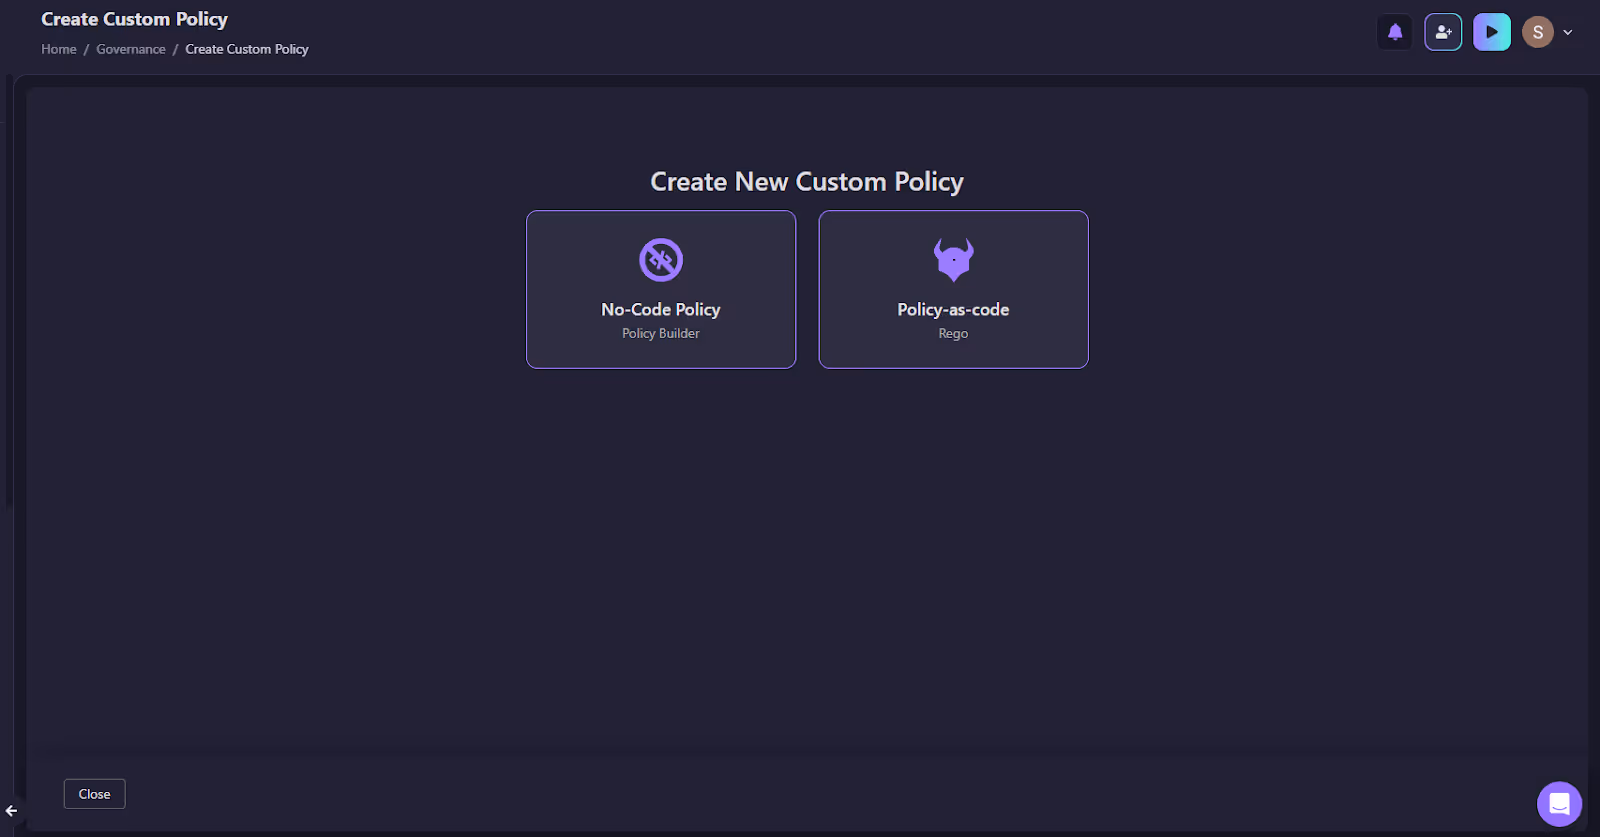
Teams can either use a no-code interface or write Rego policies directly in the built-in editor.
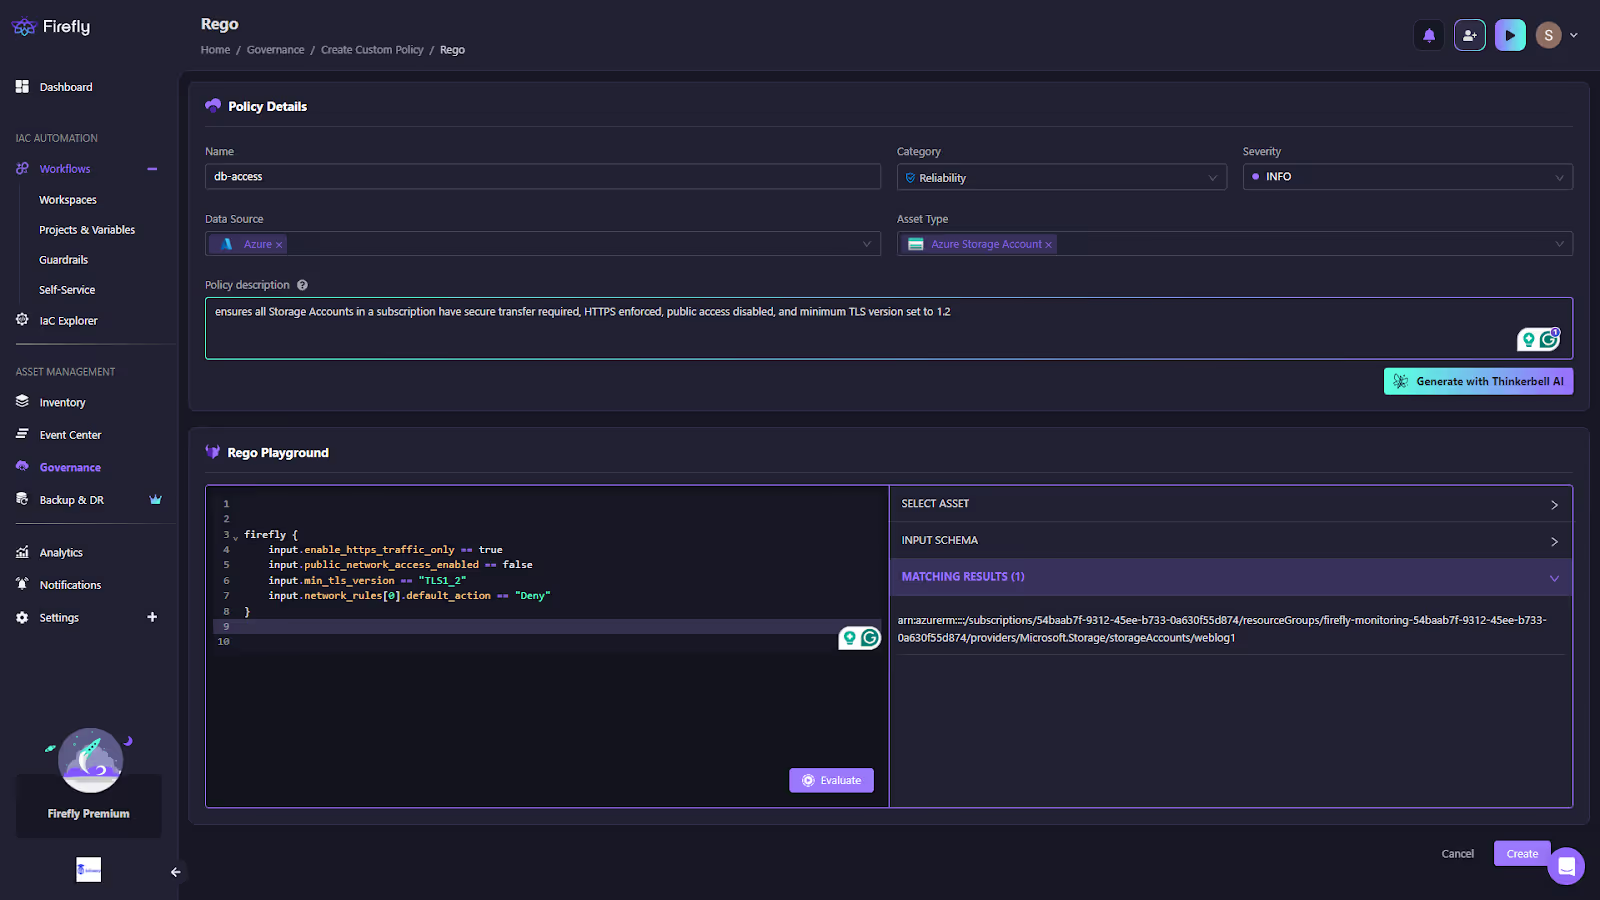
The Rego Playground, as shown in the snapshot above, enables testing policies against live asset schemas. Additionally, Thinkerbell AI is available to auto-generate policy logic from plain descriptions, like in the example above, a custom DB-access policy is defined for Azure Storage Accounts. The rule enforces HTTPS-only traffic, blocks public network access, requires a minimum TLS version of 1.2, and denies insecure default actions. The right-hand pane shows matching resources, proving the policy is actively scanning live infrastructure.
Notification Setup
After creating the DB-access policy, teams can wire up alerts for any violations. The screenshot below shows a notification rule configured for the db-access policy, where violations can trigger a Slack webhook or email.
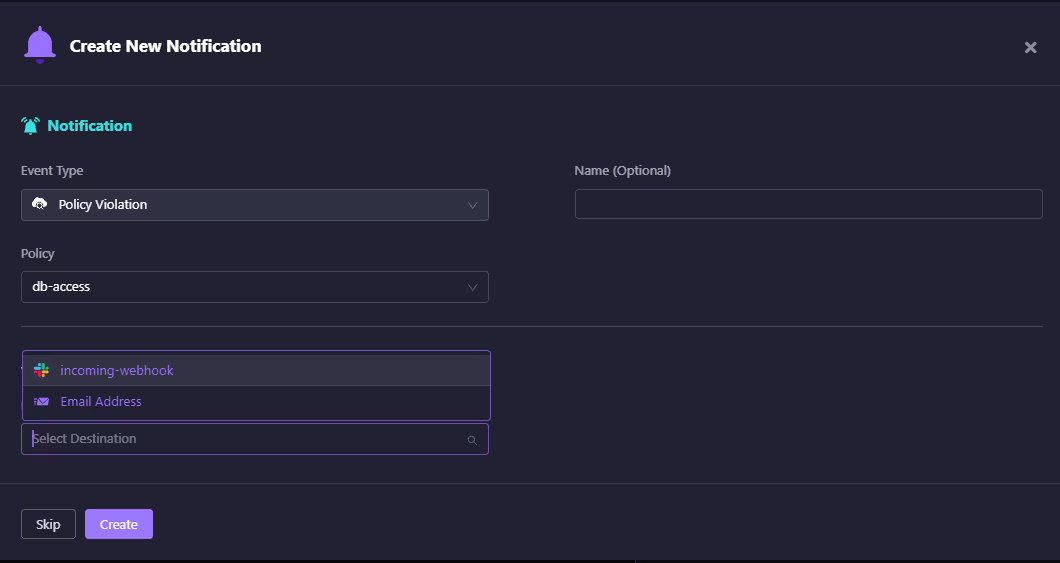
This ensures that when a storage account drifts out of compliance, the right team is instantly notified without manual checks.
By combining deployment-time enforcement, runtime evaluation, and real-time notifications, Firefly makes governance continuous and actionable. Teams don’t just block unsafe changes before release; they also get alerted when live systems deviate, keeping compliance always in sync with reality.
Observability & Change Intelligence
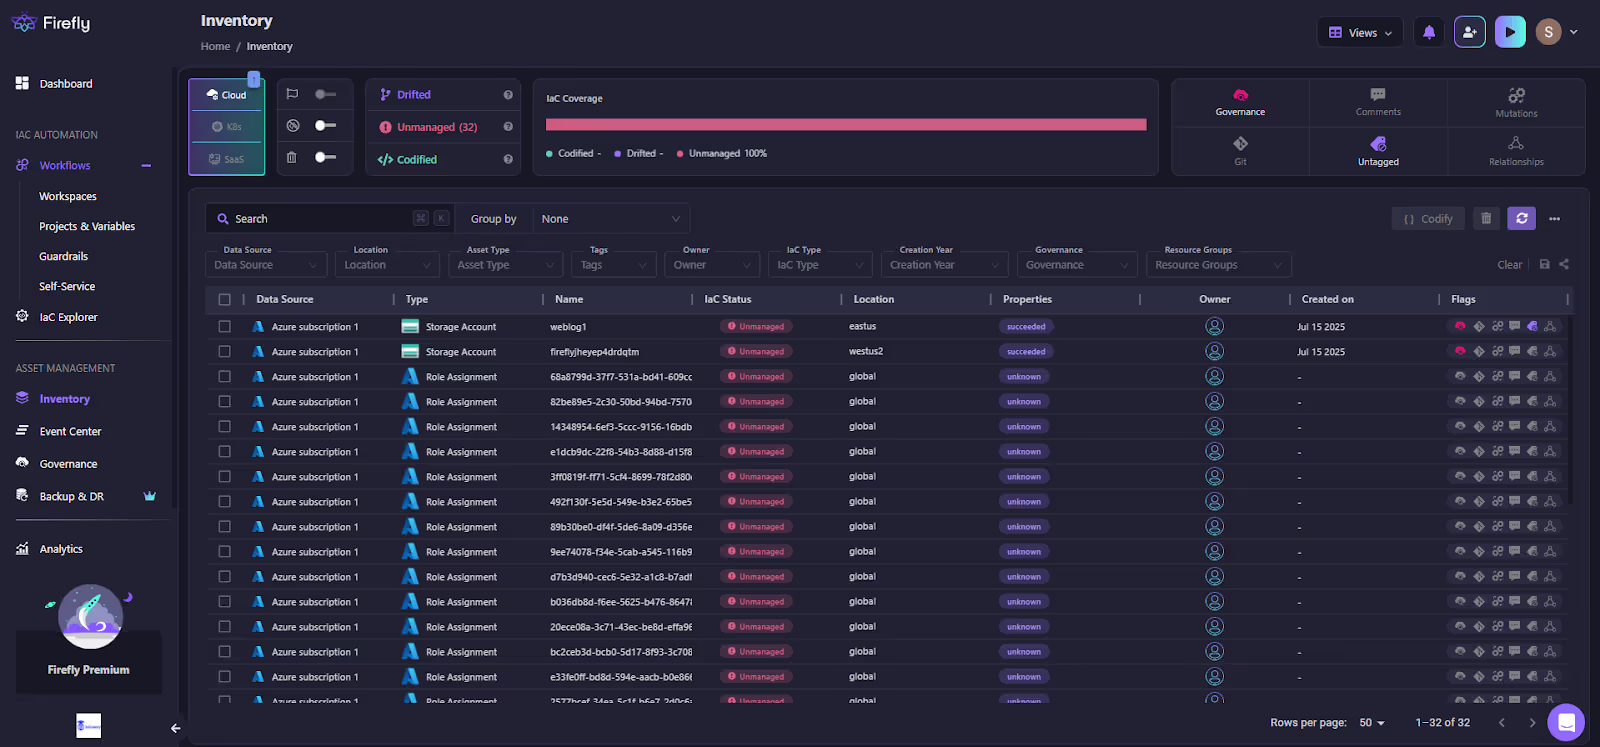
As shown in the above view, Firefly builds a complete inventory of your resources across AWS, Azure, GCP, Kubernetes, and SaaS. That visibility means incidents aren’t just “latency spike on checkout,” but “latency spike after ALB drift vs. Terraform plan.” Every change event is tracked and tied back to the owning repo and team.
- Platform Engineering Support: Firefly integrates with Backstage and CI/CD systems, so paved paths stay compliant. The golden templates teams use inherit security and cost guardrails automatically, removing the burden from individual developers.
- Security & Compliance: Firefly continuously monitors infrastructure state against policy and IaC. Drifted or unmanaged resources (like a manually created SG rule) are surfaced immediately. Signed artifacts and IaC alignment give auditors traceability without extra work.
- FinOps Built-In: Costs are tied directly to infra inventory and IaC. Firefly flags orphaned resources, idle workloads, or costly scaling policies and push insights into Slack, Jira, or ServiceNow. Teams can view spend per service and block merges when cost caps are exceeded.
Without Firefly, teams end up juggling multiple tools, Infracost, OPA, drift detection scripts, and custom dashboards, and hoping they hold together. With Firefly, these guardrails and insights are delivered through one platform, cutting the overhead of integration and reducing the risk of blind spots.
FAQs
What are the 5 levels of DevOps Practice?
DevOps maturity usually progresses in five steps. Teams start with basic automation, CI/CD, IaC, and containerization. Next come guardrails in CI, like policy and cost checks. Then, observability across logs, metrics, and traces. Fourth is platform engineering with golden templates and self-service flows. The final step is closed-loop automation with progressive delivery, chaos testing, and automated rollback tied to SLOs.
What is the main Advantage of using DevOps Practices?
The biggest advantage is speed without losing safety. You can ship features quickly while relying on automated guardrails for security, compliance, and cost control. Instead of manual reviews slowing things down, pipelines enforce the rules consistently, so teams move fast and stay reliable.
What are the Sustainable Practices of DevOps?
Sustainability in DevOps comes from automation and standardization. Security scans, cost checks, and compliance validations are built into every pipeline. Golden templates ensure consistency across services so you don’t get snowflake infra. Observability and change tracking reduce firefighting, while incremental adoption keeps improvements manageable instead of overwhelming.
What is the Key Practice of DevOps?
Infrastructure as Code is the core. Once infra is declarative and versioned, everything else becomes easier; you can add policy-as-code, automate security checks, measure costs, and tie observability directly to commits. Without IaC, the rest of the practices don’t scale or hold together in production.

.avif)
.avif)


.webp)


.webp)


